Full Report
The numbers behind Vital Farms, Inc.: as-reported financial statements and company metrics for FY2021–FY2025, traced to the source filings, opened with the share-price history those statements have to justify. Every linked figure opens the exact page of the filing it was printed on, with the statement row highlighted. Amounts in US$ thousands unless noted.
Reading notes: All figures are in thousands of U.S. dollars, as printed in Vital Farms' Form 10-K statements (“Amounts in thousands”). years columns FY2021–FY2025 are all filing-cited. FY2021–FY2022 income, cash-flow and revenue-mix figures are comparative columns of the FY2022 Form 10-K; FY2023 income/cash-flow and revenue mix are comparative columns of the FY2025 Form 10-K; FY2023 balance sheet is from the FY2024 Form 10-K. long_term FY2018–FY2019 figures are from the standardized SEC XBRL data feed and are shown without page links; FY2020–FY2025 long-term figures are filing-cited. Vital Farms consolidated a noncontrolling interest through FY2022. For FY2020–FY2022 the income-statement/long-term “Net income” row is the amount attributable to Vital Farms, Inc. common stockholders (which drives reported EPS): FY2022 $1,251K vs. $1,230K total; FY2021 $2,429K vs. $2,382K total; FY2020 $8,800K vs. $8,884K total. The cash-flow “Net income” line is the total (pre-attribution) figure as printed at the top of that statement ($1,230K FY2022, $2,382K FY2021).
Share Price — Full Available History — 6 Years
The stock closed at $13.02 on Jul 24, 2026 — down 63% over the window shown (-15.3% a year), trading between $8.17 and $52.41. At that close the stock trades at 9.0× FY2025 diluted EPS as reported below.
Source: market price feed, weekly closes, sampled from 1,503 source observations, Jul 2020–Jul 2026. Price return only, excludes dividends.
Market capitalization $459mn.
Market cap = 35.3M shares outstanding × the Jul 24, 2026 close of $13.02. Market-derived, shown without filing links.
FY2025 at a Glance
Revenue (US$ thousands)
Net income (US$ thousands)
Diluted EPS
Source: FY2025 consolidated statements [1] [2]. Click any linked figure to open the filing page with the row highlighted.
Net Revenue by Product
| Net Revenue by Product | FY2021 | FY2022 | FY2023 | FY2024 | FY2025 |
|---|---|---|---|---|---|
| Eggs and egg-related products | 239,967 | 339,214 | 449,045 | 580,954 | 733,176 |
| Butter and butter-related products | 20,934 | 22,836 | 22,812 | 25,353 | 26,268 |
| Net Revenue | 260,901 | 362,050 | 471,857 | 606,307 | 759,444 |
| Net Revenue growth, derived | — | +38.8% | +30.3% | +28.5% | +25.3% |
Source: Note: Revenue Recognition — disaggregation of net revenue by primary product [3] [4]. Click any linked figure to open the filing page with the row highlighted.
Income Statement
Source: Consolidated Statements of Income (FY2022 10-K: Statements of Operations) [1] [2]. Click any linked figure to open the filing page with the row highlighted.
Columns marked E are consensus analyst estimates from S&P Capital IQ (CapIQ), shown alongside reported results for direct comparison; they are not company guidance.
Estimate source: S&P Capital IQ (CapIQ) consensus, as of 2026-07-26. Estimate figures are S&P Capital IQ consensus (vendor data — no filing page links). EPS and net income use the normalized (adjusted) consensus where the street reports it. Line-item analyst models (segments, drivers, KPIs) are in the Visible Alpha tab.
Balance Sheet
Source: Consolidated Balance Sheets [5] [6] [7]. Click any linked figure to open the filing page with the row highlighted.
Cash Flow
Source: Consolidated Statements of Cash Flows [8] [9] [10]. Click any linked figure to open the filing page with the row highlighted.
Consumer Reach Brand Penetration
| Consumer Reach Brand Penetration | FY2021 | FY2022 | FY2023 | FY2024 | FY2025 |
|---|---|---|---|---|---|
| Household penetration — shell eggs | 5.0% | 7.0% | 7.5% | 9.2% | 10.5% |
| U.S. households reached | — | — | — | 14,000,000 | 16,000,000 |
| Retail distribution — number of stores | 20,900 | 22,000 | 24,000 | 24,000 | 24,000 |
| Retail SKUs offered | 32 | 25 | 23 | 23 | 23 |
Source: company filings [11] [12] [13] [14]. Click any linked figure to open the filing page with the row highlighted.
Supply Chain Capacity
| Supply Chain Capacity | FY2021 | FY2022 | FY2023 | FY2024 | FY2025 |
|---|---|---|---|---|---|
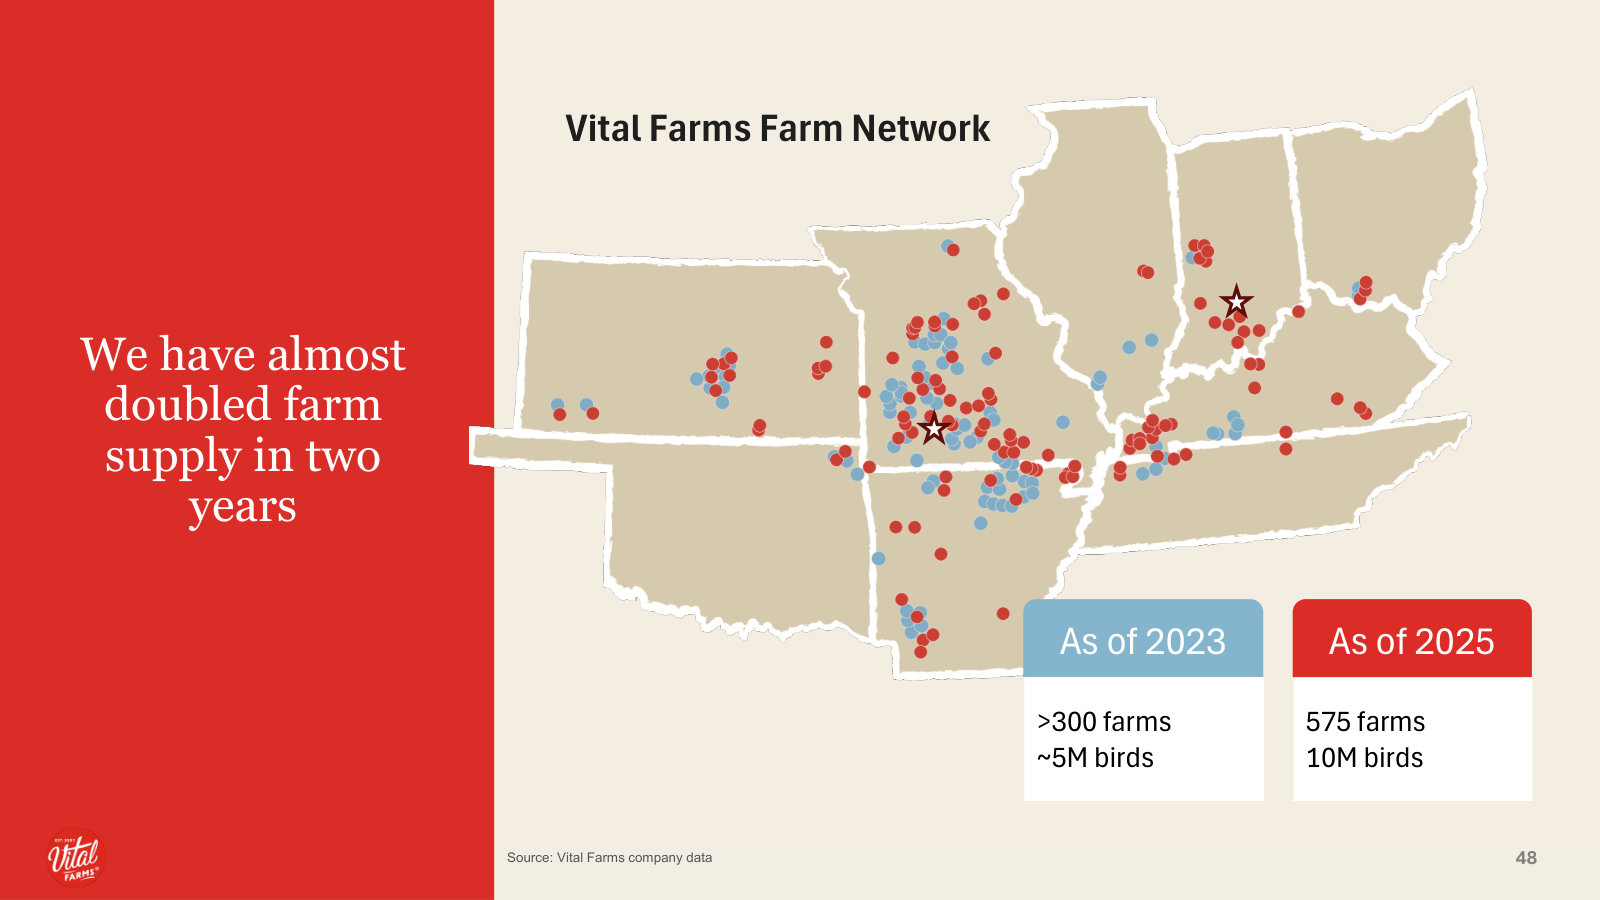
| Family farms in network | 275 | 300 | 300 | 425 | 600 |
| Egg Central Station packing capacity (eggs/day) | 3,000,000 | 6,000,000 | 6,000,000 | 6,000,000 | 7,500,000 |
Source: company filings [12] [15] [16] [17]. Click any linked figure to open the filing page with the row highlighted.
Profitability (Non-GAAP)
| Profitability (Non-GAAP) | FY2021 | FY2022 | FY2023 | FY2024 | FY2025 |
|---|---|---|---|---|---|
| Adjusted EBITDA | 8,049 | 16,236 | 48,348 | 86,663 | 114,026 |
Source: company filings [18] [19] [20] [21]. Click any linked figure to open the filing page with the row highlighted.
Category Size Opportunity (U.S. retail sales)
| Category Size Opportunity (U.S. retail sales) | FY2021 | FY2022 | FY2023 | FY2024 | FY2025 |
|---|---|---|---|---|---|
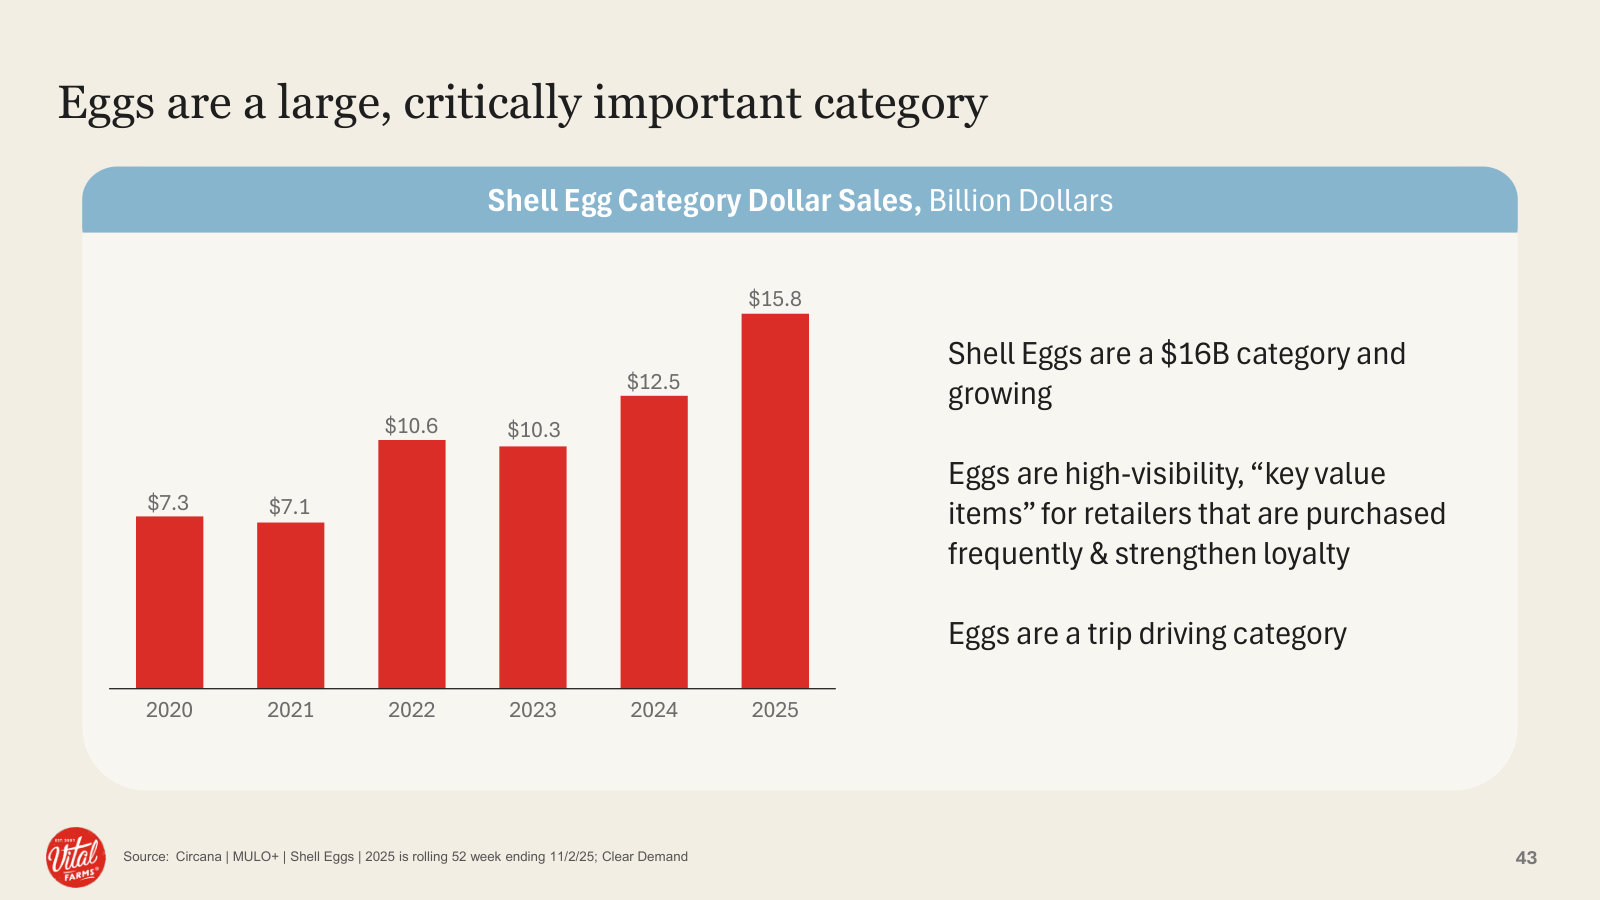
| U.S. shell egg category — retail sales | 6,200,000 | 9,400,000 | 9,000,000 | 12,500,000 | 15,400,000 |
| U.S. pasture-raised egg category — retail sales | 303,000 | 428,000 | 531,000 | 994,400 | 1,300,000 |
| Shell egg category household penetration | 98.0% | 98.0% | 96.5% | 97.0% | 97.3% |
Source: company filings [11] [13] [22] [23]. Click any linked figure to open the filing page with the row highlighted.
Long-Term Record
| Fiscal year | Net revenue | Income from operations | Net income | Diluted earnings per share | Net cash provided by (used in) operating activities | Purchases of property, plant and equipment |
|---|---|---|---|---|---|---|
| FY2018 | 106,713 | 6,767 | 5,797 | 0.16 | 11,424 | (1,940) |
| FY2019 | 140,733 | 3,350 | 2,385 | 0.07 | (5,352) | (4,799) |
| FY2020 | 214,280 | 12,228 | 8,800 | 0.27 | 11,512 | (10,300) |
| FY2021 | 260,901 | 52 | 2,429 | 0.06 | 17,682 | (16,711) |
| FY2022 | 362,050 | 2,104 | 1,251 | 0.03 | (8,098) | (10,468) |
| FY2023 | 471,857 | 33,254 | 25,566 | 0.59 | 50,906 | (11,538) |
| FY2024 | 606,307 | 63,552 | 53,388 | 1.18 | 64,824 | (28,646) |
| FY2025 | 759,444 | 88,373 | 66,282 | 1.44 | 33,715 | (81,950) |
Source: consolidated statements across filings; older years from the standardized feed [9] [1] [10] [2]. Click any linked figure to open the filing page with the row highlighted.
Operating KPIs
| KPI | FY2021 | FY2022 | FY2023 | FY2024 | FY2025 |
|---|---|---|---|---|---|
| Retail stores selling our products | 20,900 | 22,000 | 24,000 | 24,000 | 24,000 |
| Shell egg household penetration | 5.0% | 7.0% | 7.5% | 9.2% | 10.5% |
| Family farms in network | — | — | — | 425 | 600 |
Source: company-reported operating metrics [24] [25] [15]. Click any linked figure to open the filing page with the row highlighted.
Analyst Consensus
Mean target
Median target
High target
Low target
Street ratings: 2 strong buy, 1 buy, 7 hold. Consensus: Buy.
Estimate source: S&P Capital IQ (CapIQ) consensus, as of 2026-07-26. Estimate figures are S&P Capital IQ consensus (vendor data — no filing page links). EPS and net income use the normalized (adjusted) consensus where the street reports it. Line-item analyst models (segments, drivers, KPIs) are in the Visible Alpha tab.
Traceability
341 of 362 figures on this page (94%) link to the filing page where they are printed — click a linked figure to open the source PDF at that page with the row highlighted. Unlinked figures come from standardized data feeds or pre-filing years.
All figures are in thousands of U.S. dollars, as printed in Vital Farms' Form 10-K statements (“Amounts in thousands”).
years columns FY2021–FY2025 are all filing-cited. FY2021–FY2022 income, cash-flow and revenue-mix figures are comparative columns of the FY2022 Form 10-K; FY2023 income/cash-flow and revenue mix are comparative columns of the FY2025 Form 10-K; FY2023 balance sheet is from the FY2024 Form 10-K.
long_term FY2018–FY2019 figures are from the standardized SEC XBRL data feed and are shown without page links; FY2020–FY2025 long-term figures are filing-cited.
Vital Farms consolidated a noncontrolling interest through FY2022. For FY2020–FY2022 the income-statement/long-term “Net income” row is the amount attributable to Vital Farms, Inc. common stockholders (which drives reported EPS): FY2022 $1,251K vs. $1,230K total; FY2021 $2,429K vs. $2,382K total; FY2020 $8,800K vs. $8,884K total. The cash-flow “Net income” line is the total (pre-attribution) figure as printed at the top of that statement ($1,230K FY2022, $2,382K FY2021).
The FY2022 Form 10-K labels the income statement “Consolidated Statements of Operations” and disaggregates revenue under “Egg and egg-related products” (singular); the FY2024–FY2025 filings use “Consolidated Statements of Income” and “Eggs and egg-related products” (plural). Row labels use the current-filing wording; each quote is verbatim from its cited page.
Cash-flow “Depreciation and amortization” is the amount printed in the Consolidated Statements of Cash Flows (e.g. FY2025 $13,844K), which exceeds the data feed's depreciation-only figure ($9,254K); the filing line is used.
Quarterly single-quarter operating cash flows are derived from printed year-to-date statements and reconcile exactly (Q2 FY25 4,513−5,274=(761); Q3 FY25 27,935−4,513=23,422; Q4 FY25 33,715−27,935=5,780); each was cross-checked against data/financials/cash_flow_quarterly.json.
1 figure(s) differed between the data feed and the filing; the filing value is shown (see the run's metrics/metrics_tab.json for the audit trail).
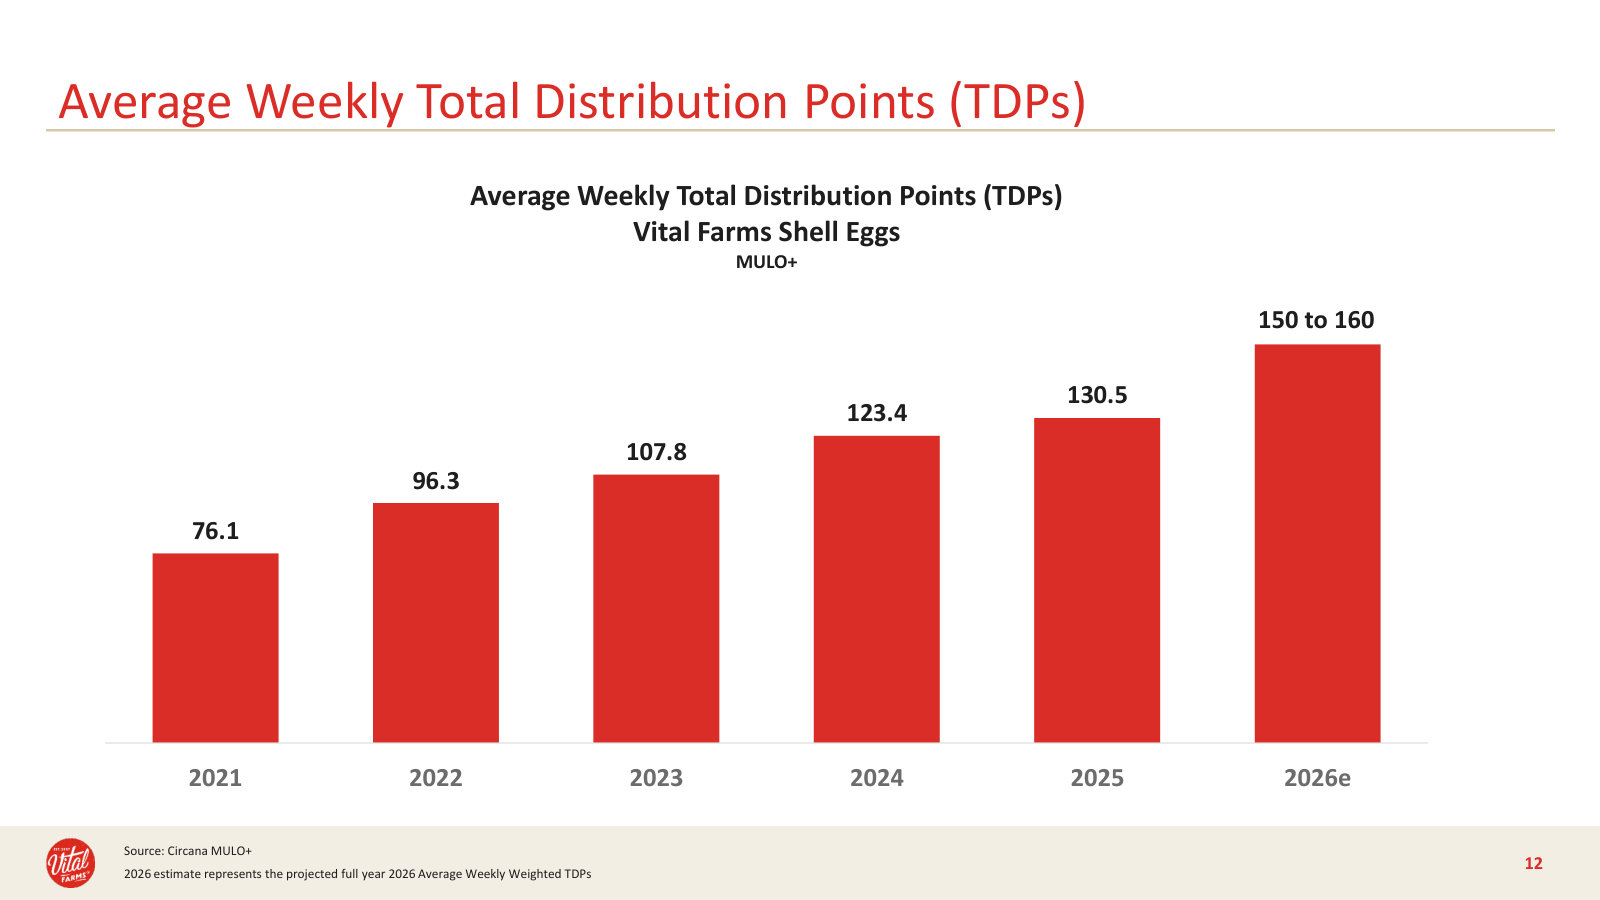
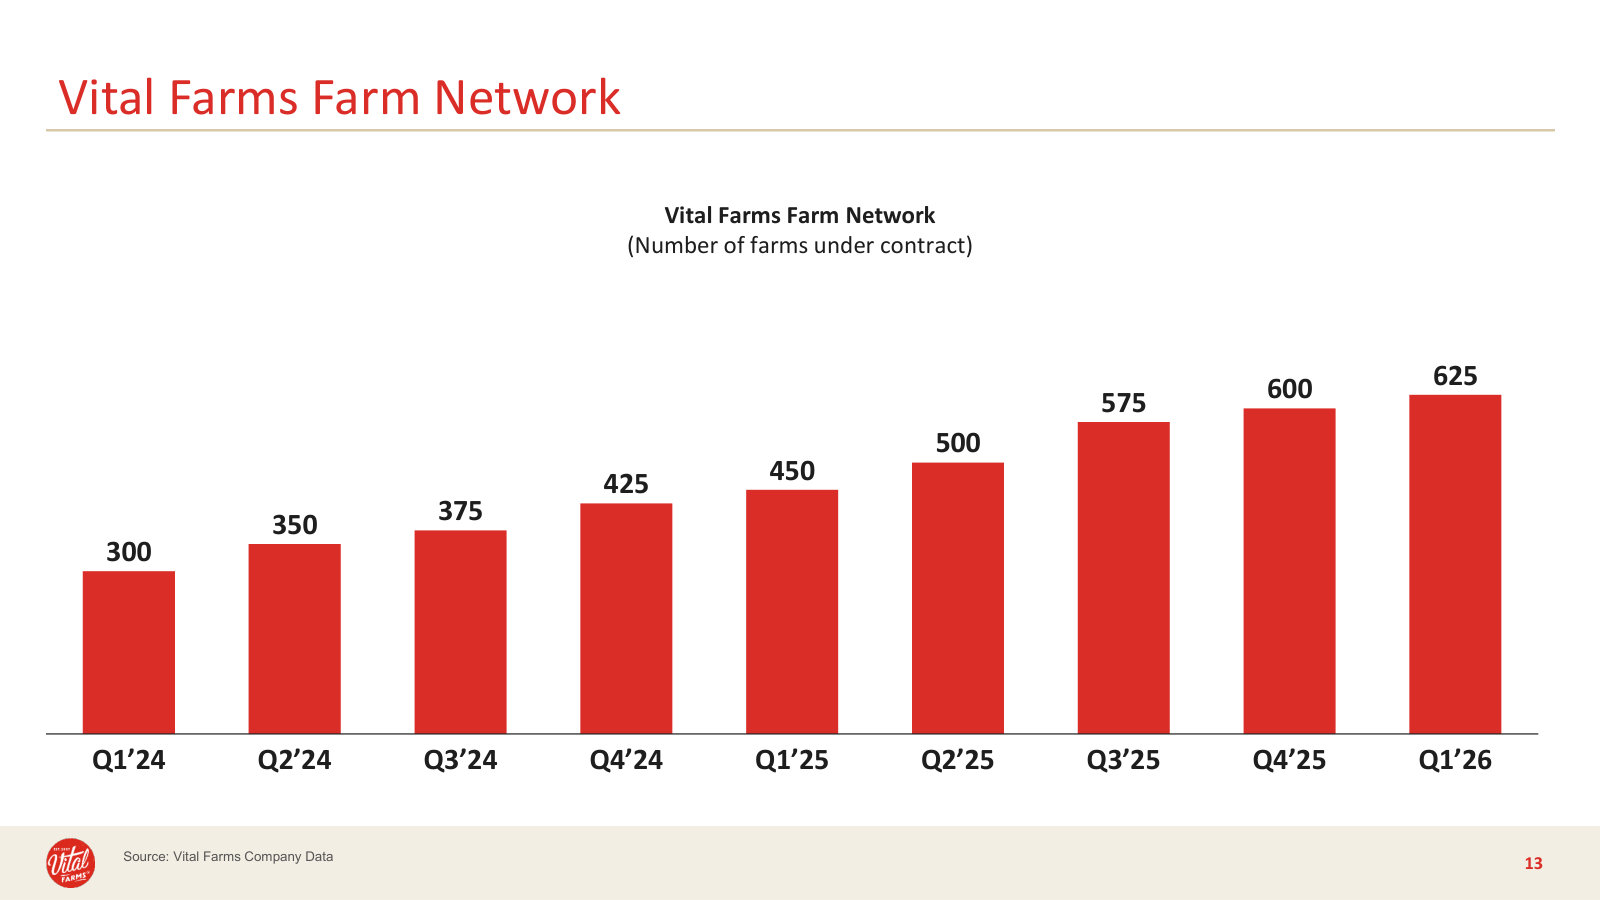
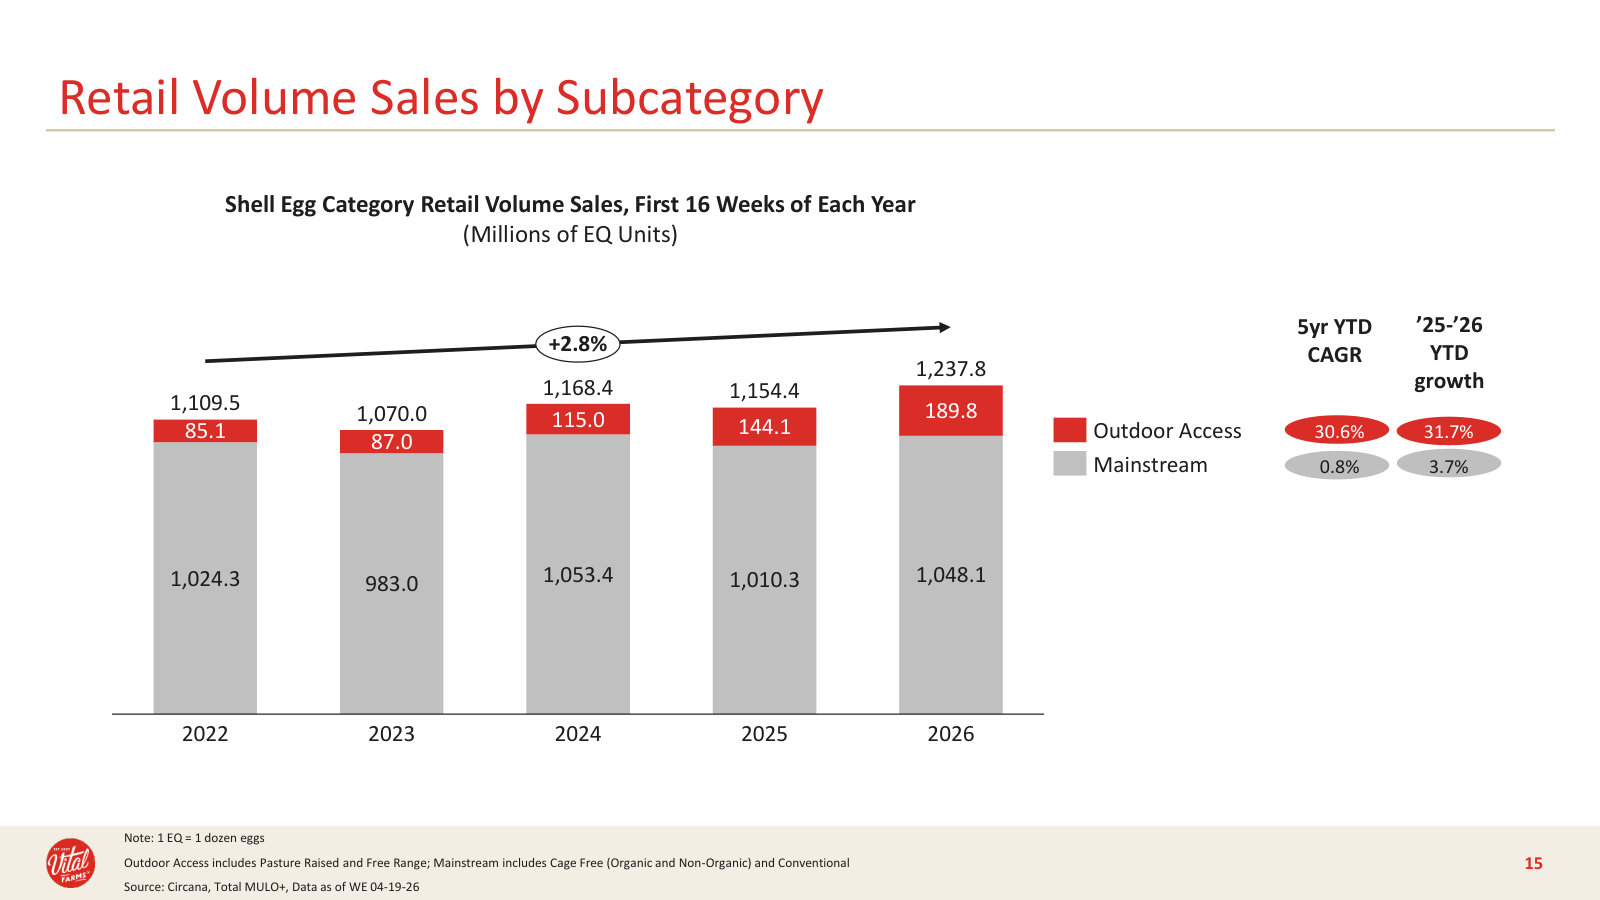
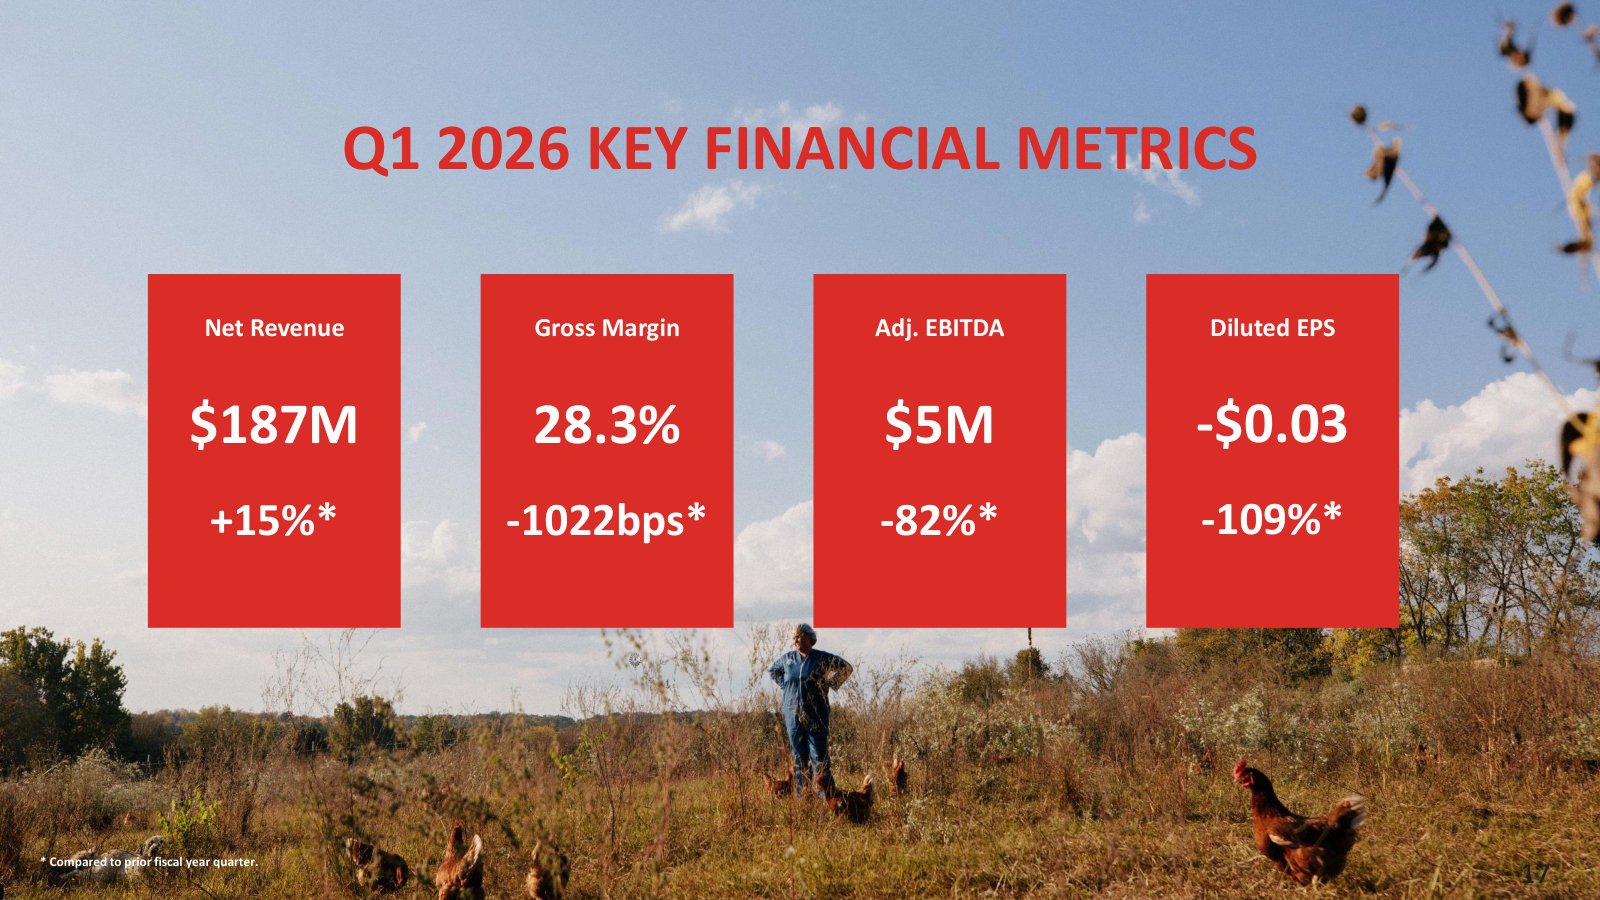
Vital Farms, Inc.'s management explains the business in its own materials. The slides below do the most of that work, pulled from the documents preserved in Sources. Each source link opens the complete presentation at that slide in a new tab.
2025 Investor Day — 2025
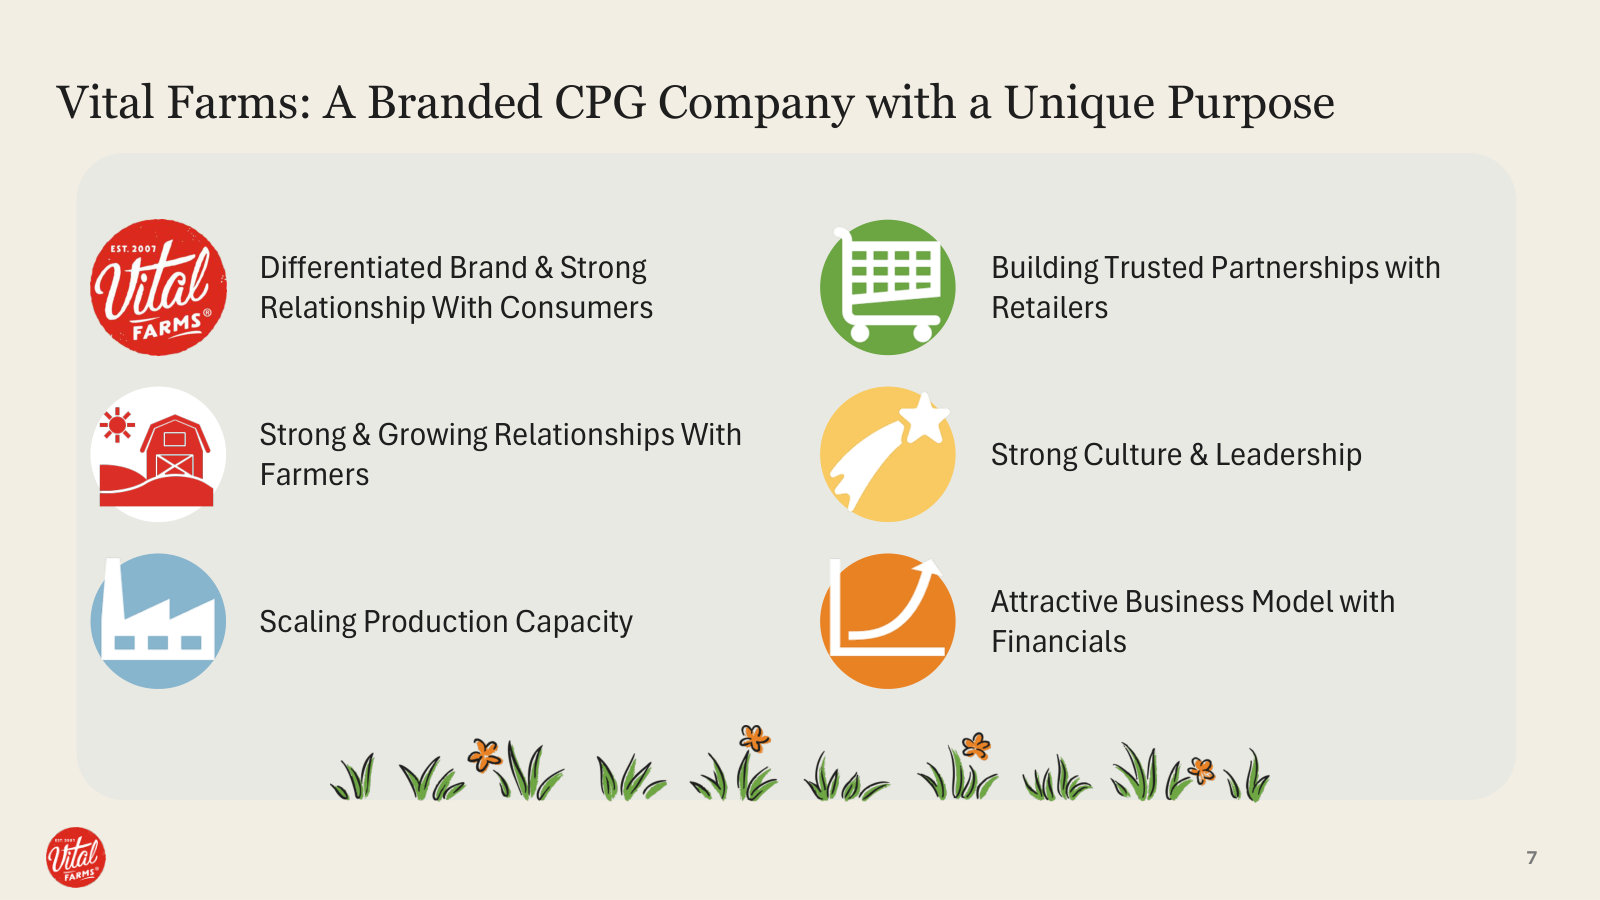
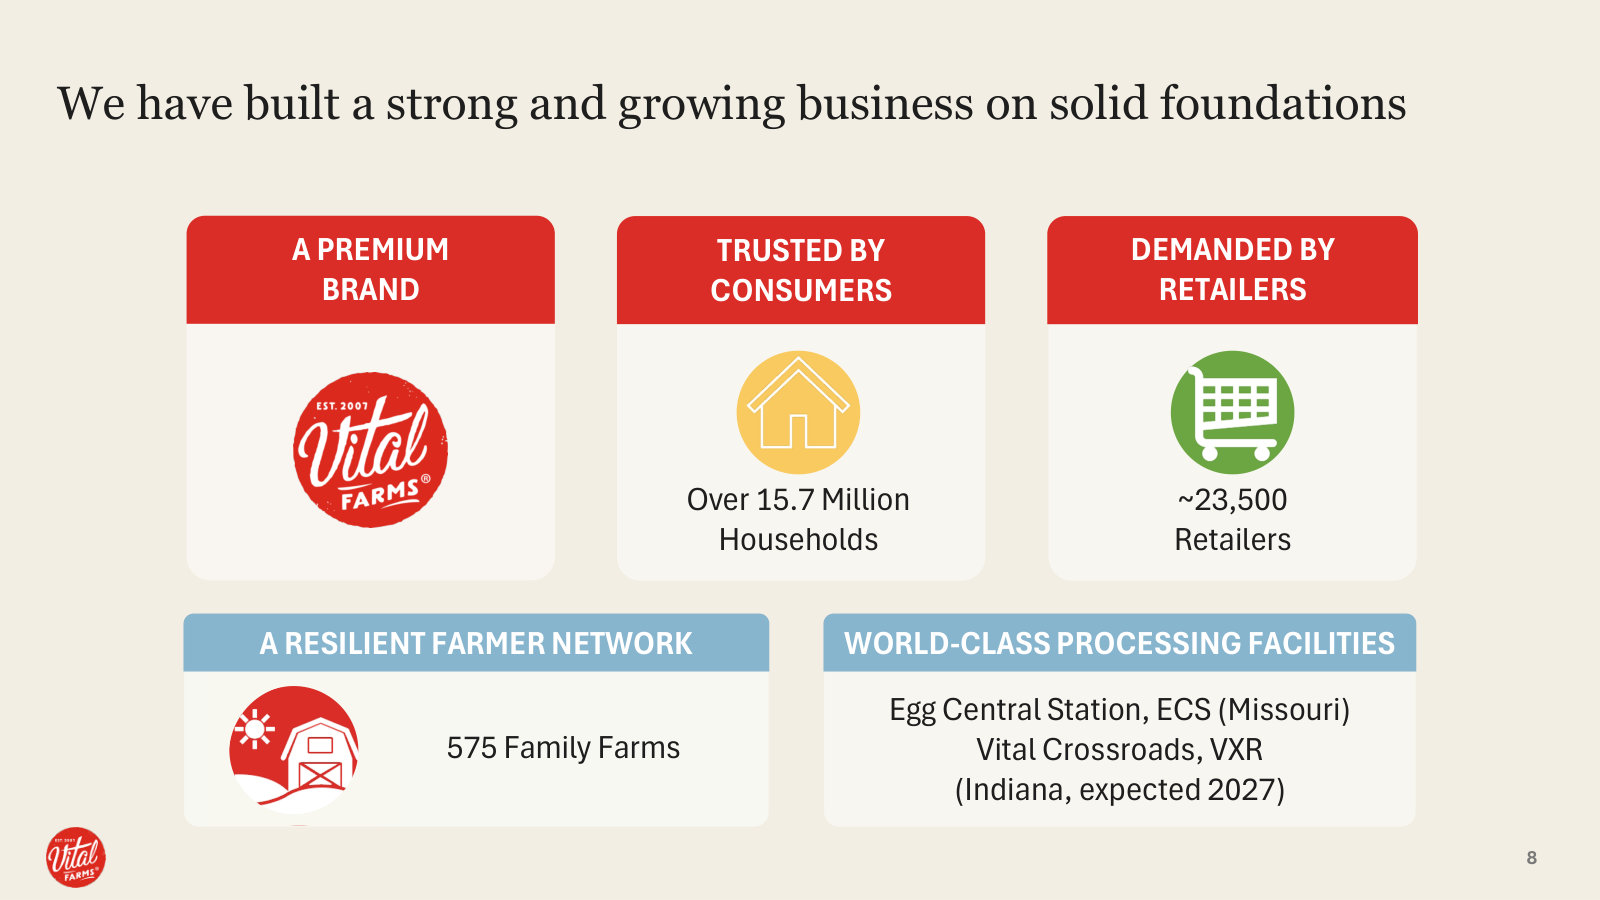
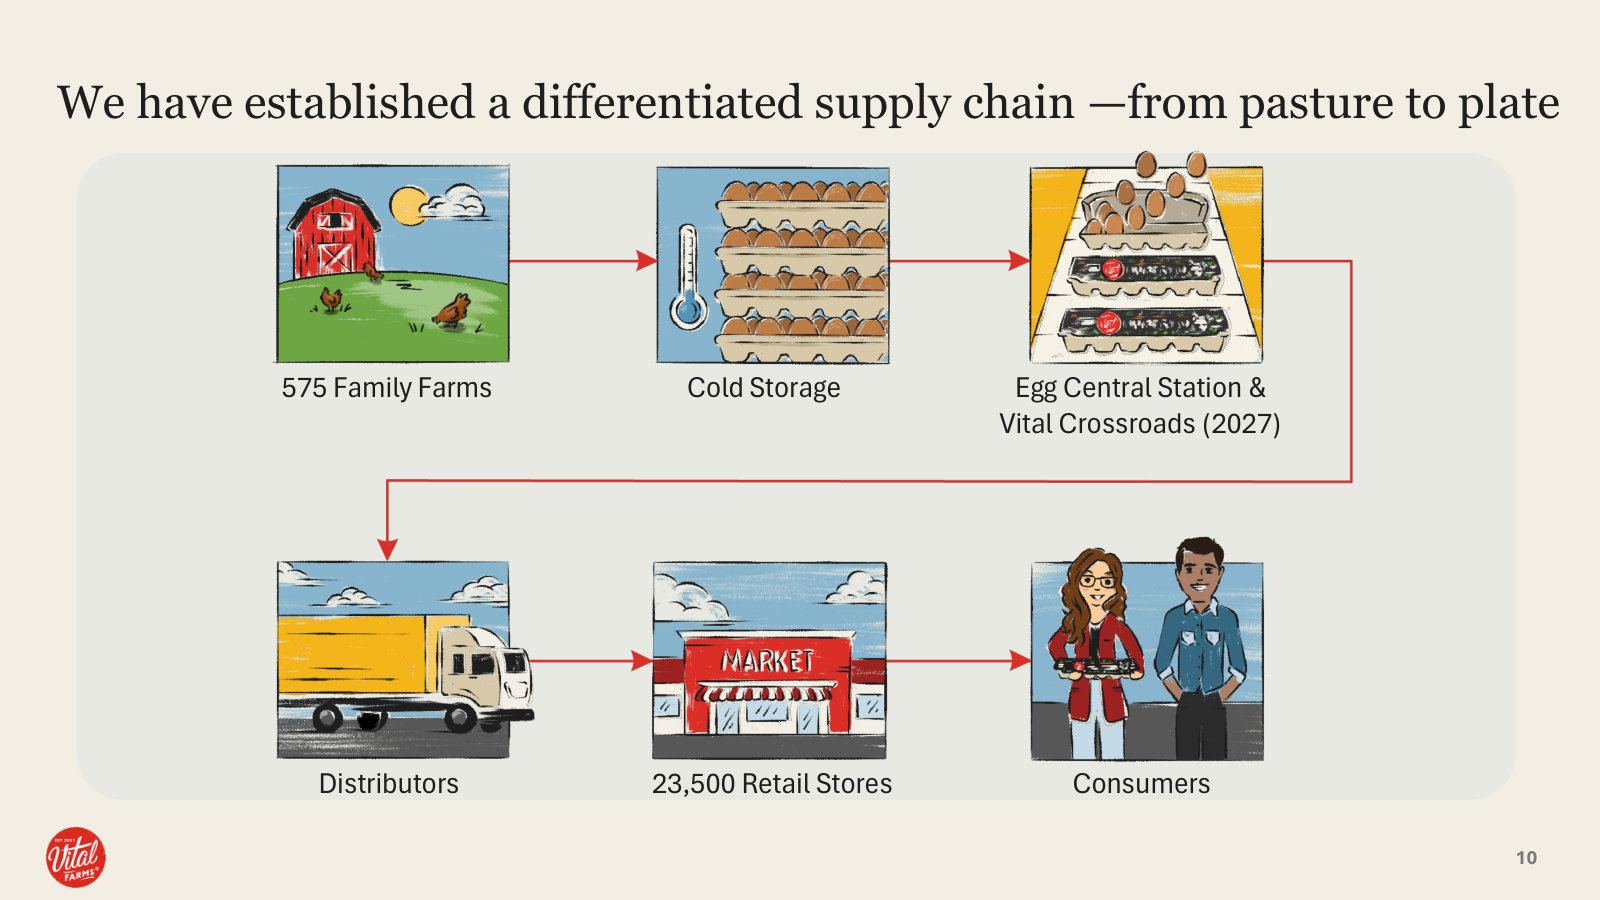
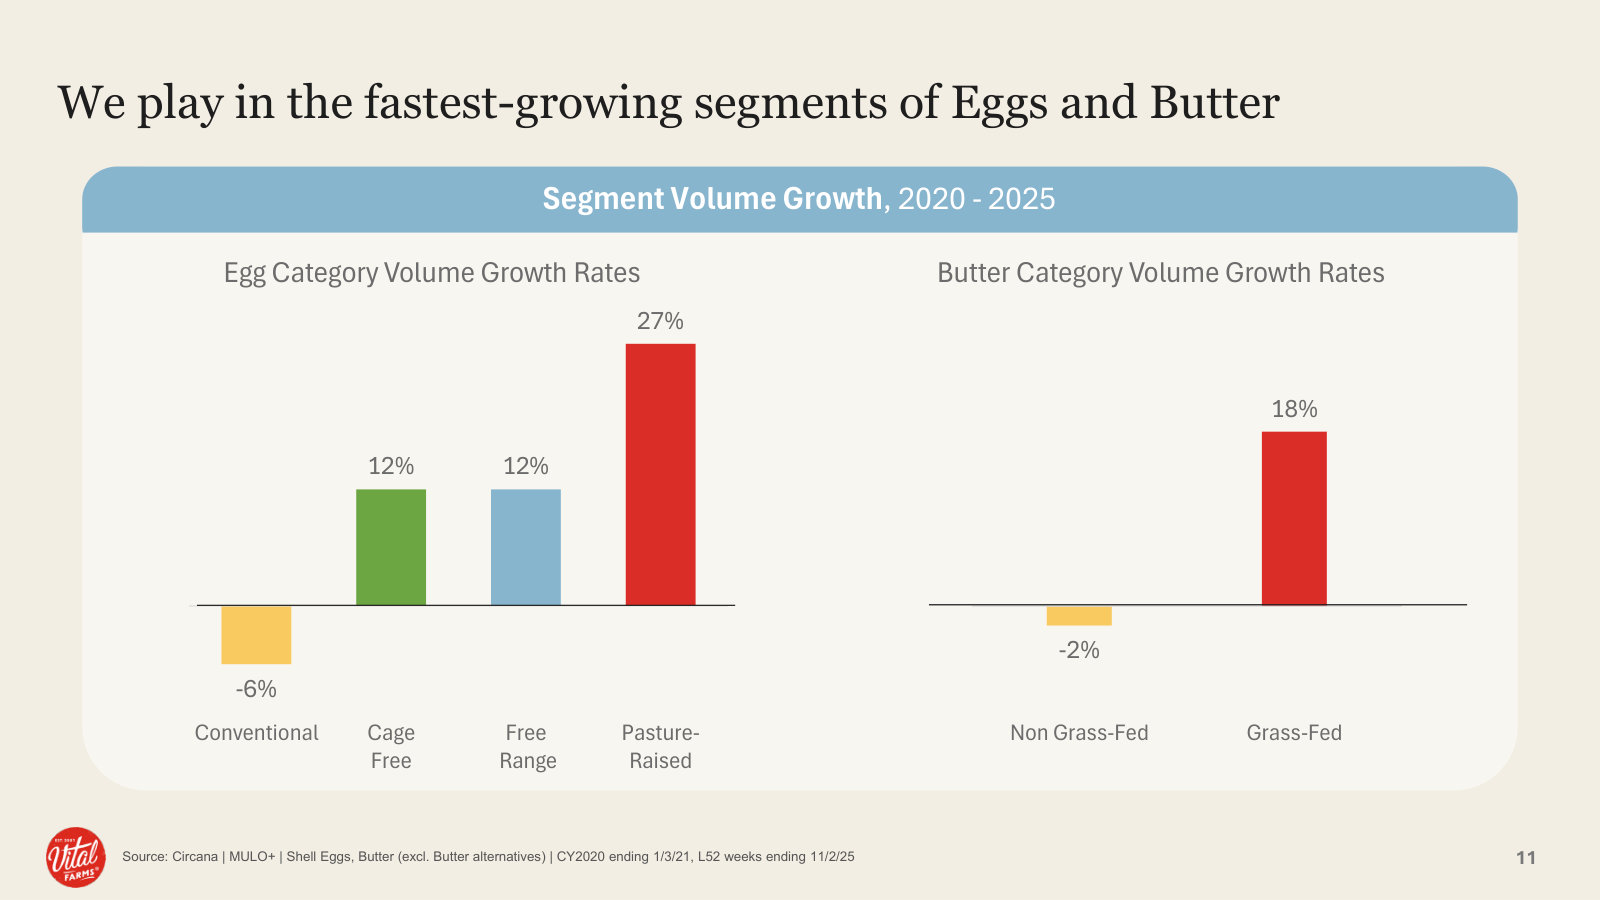
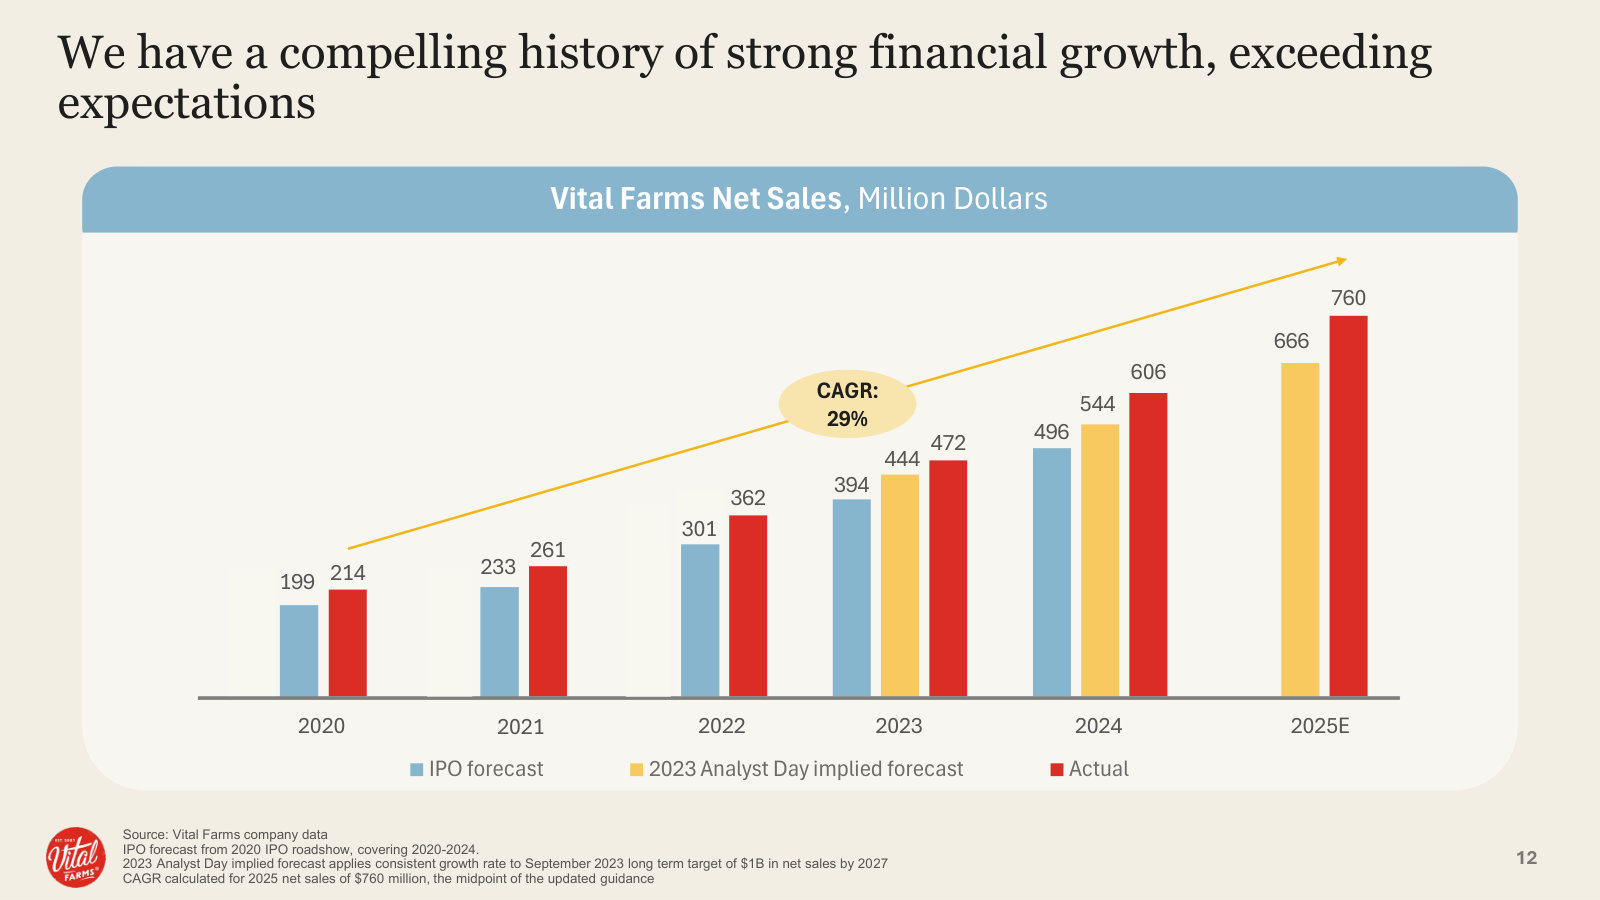
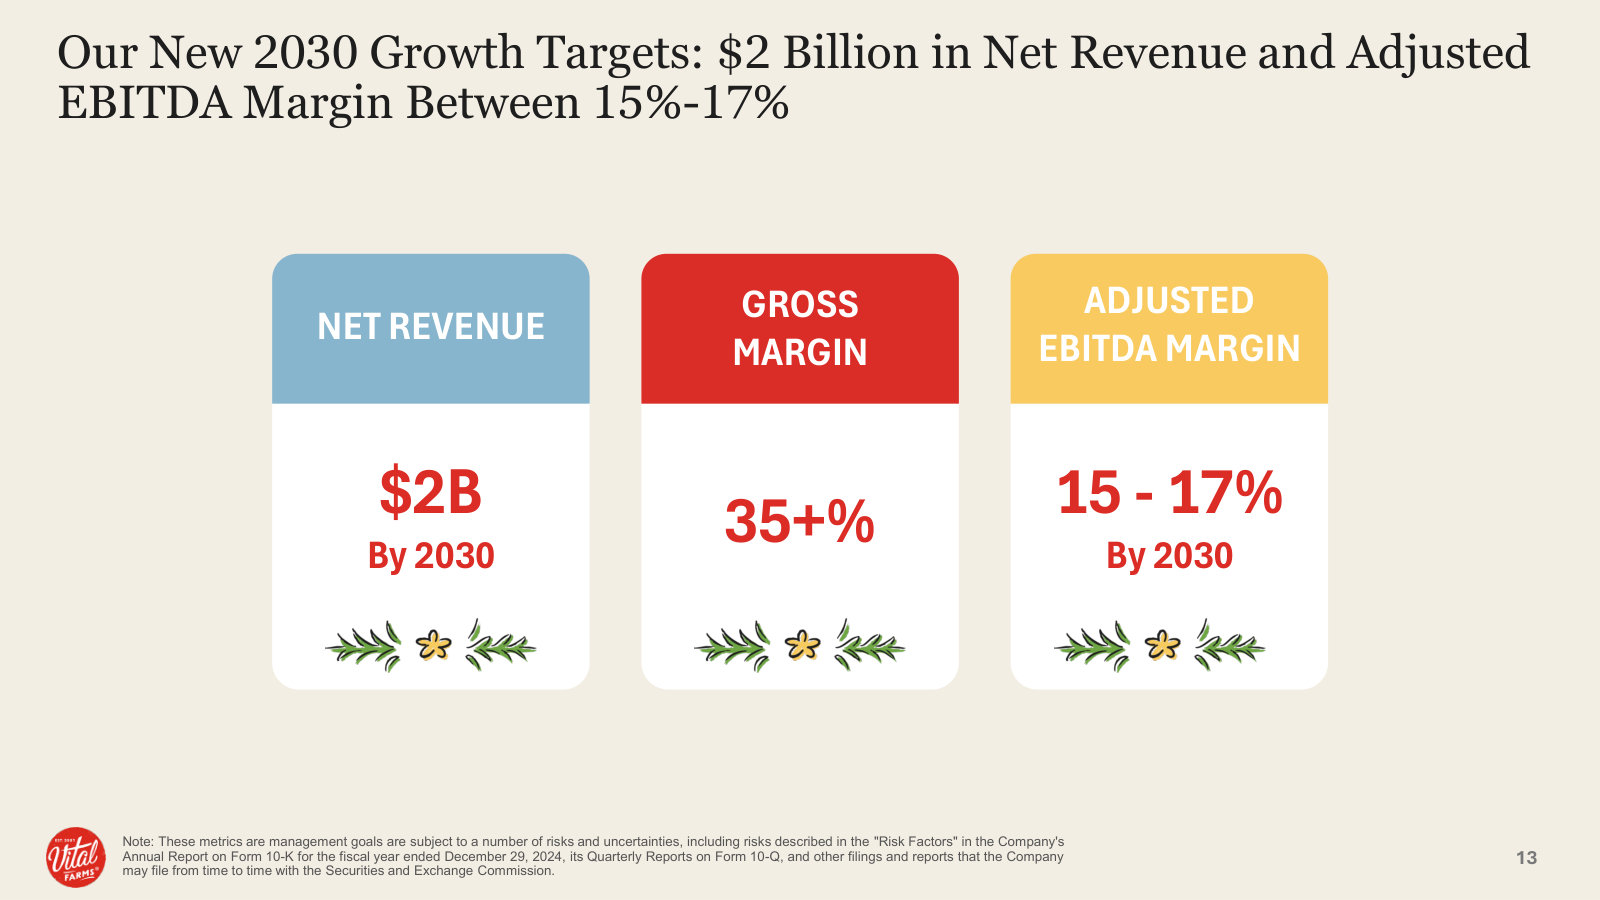
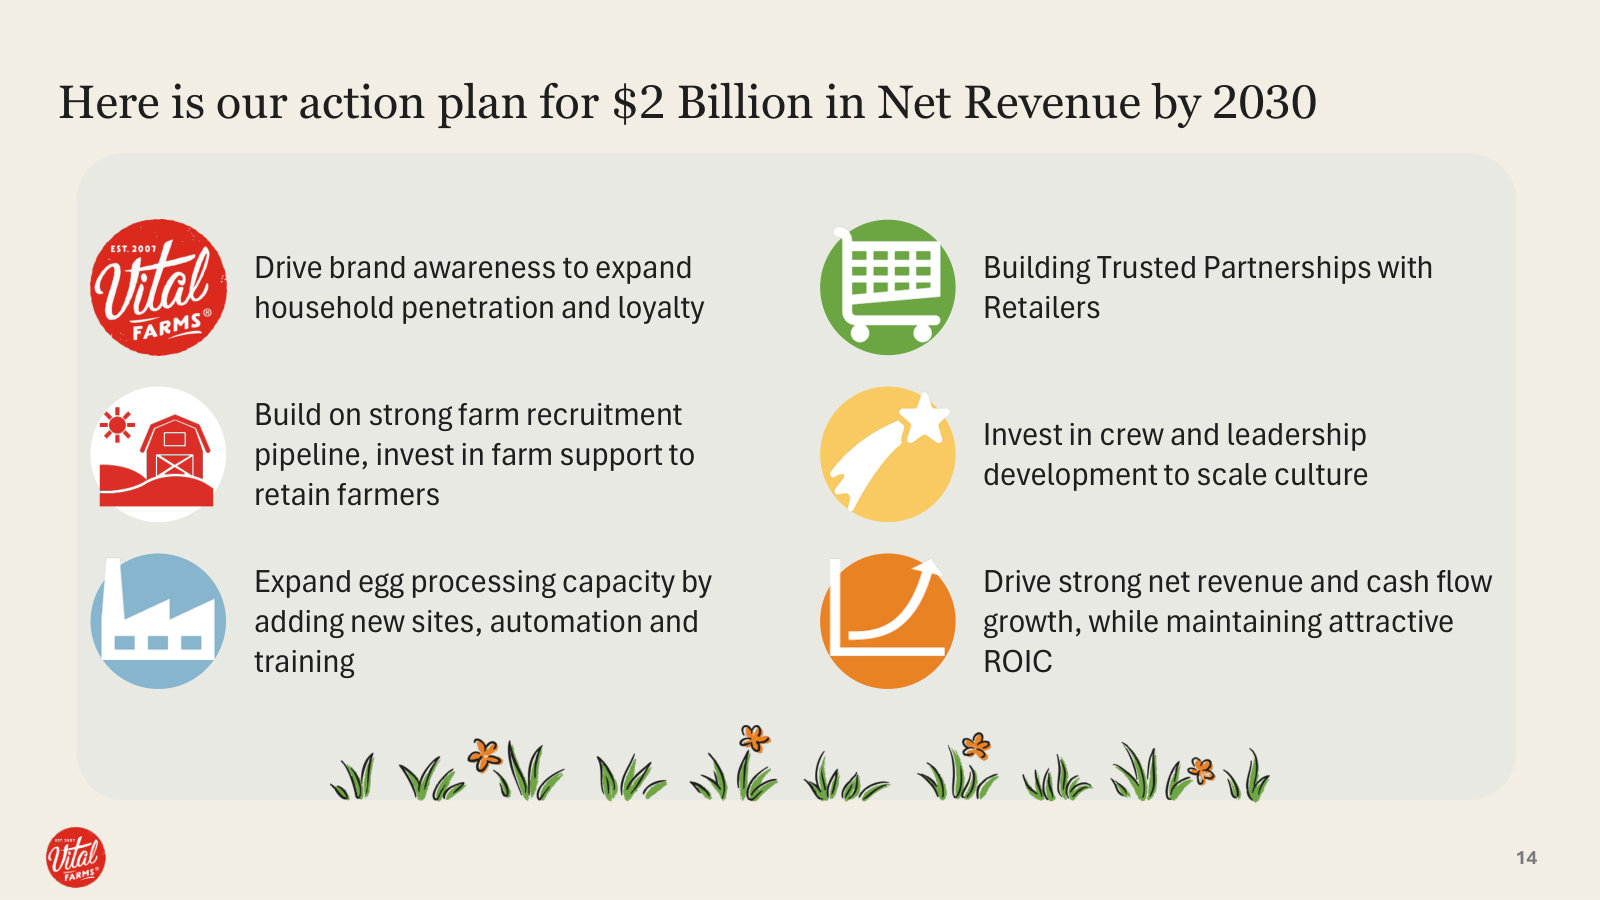
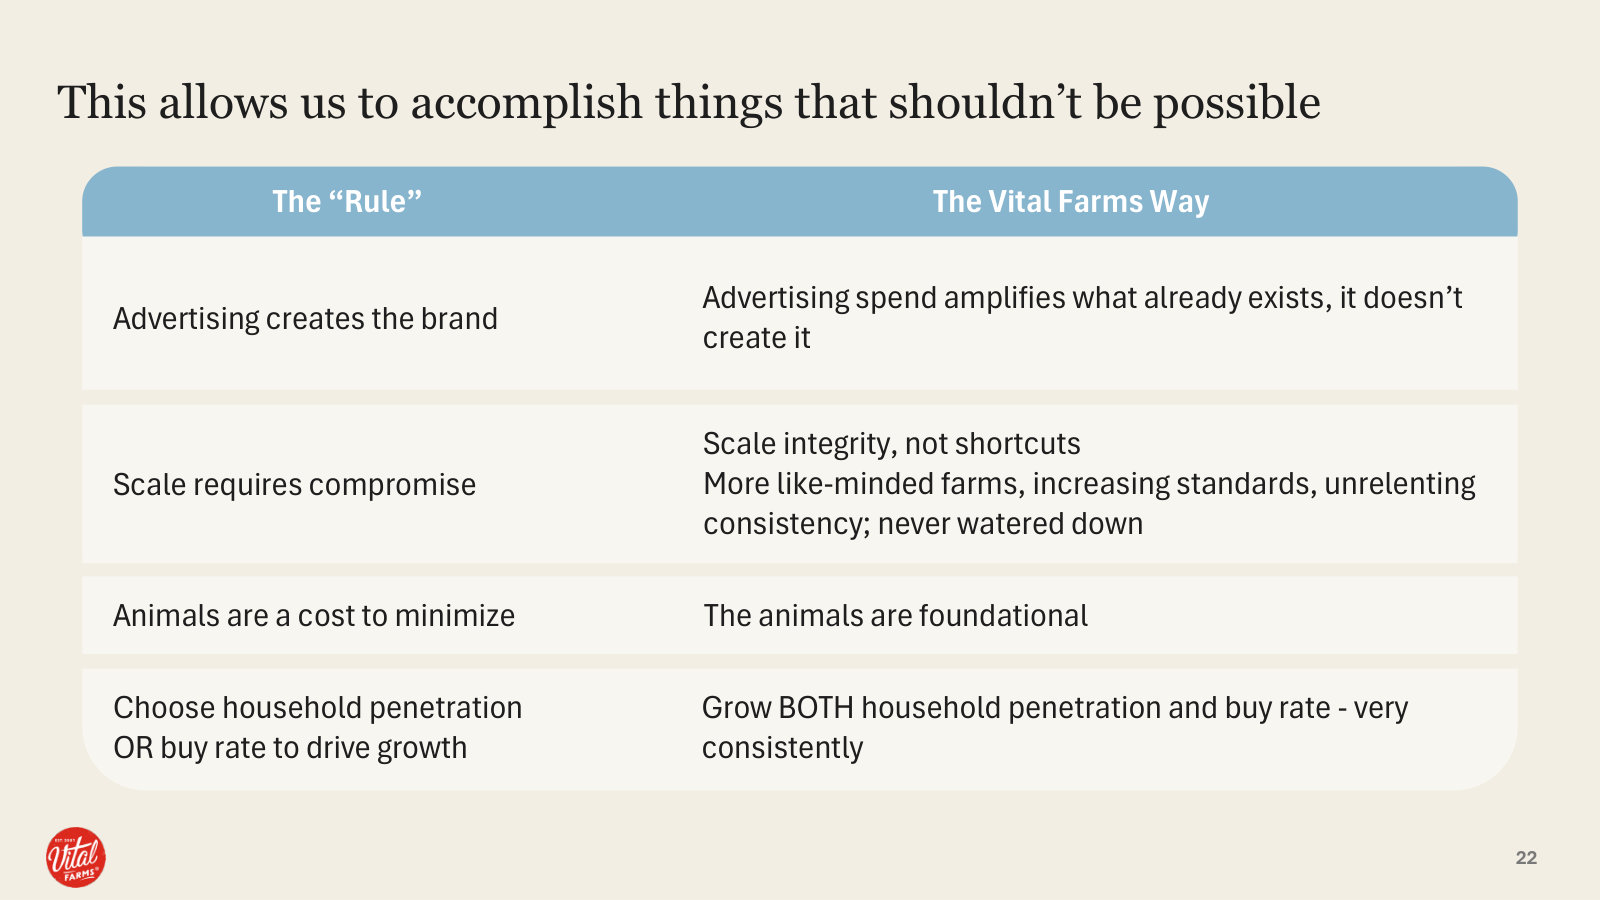
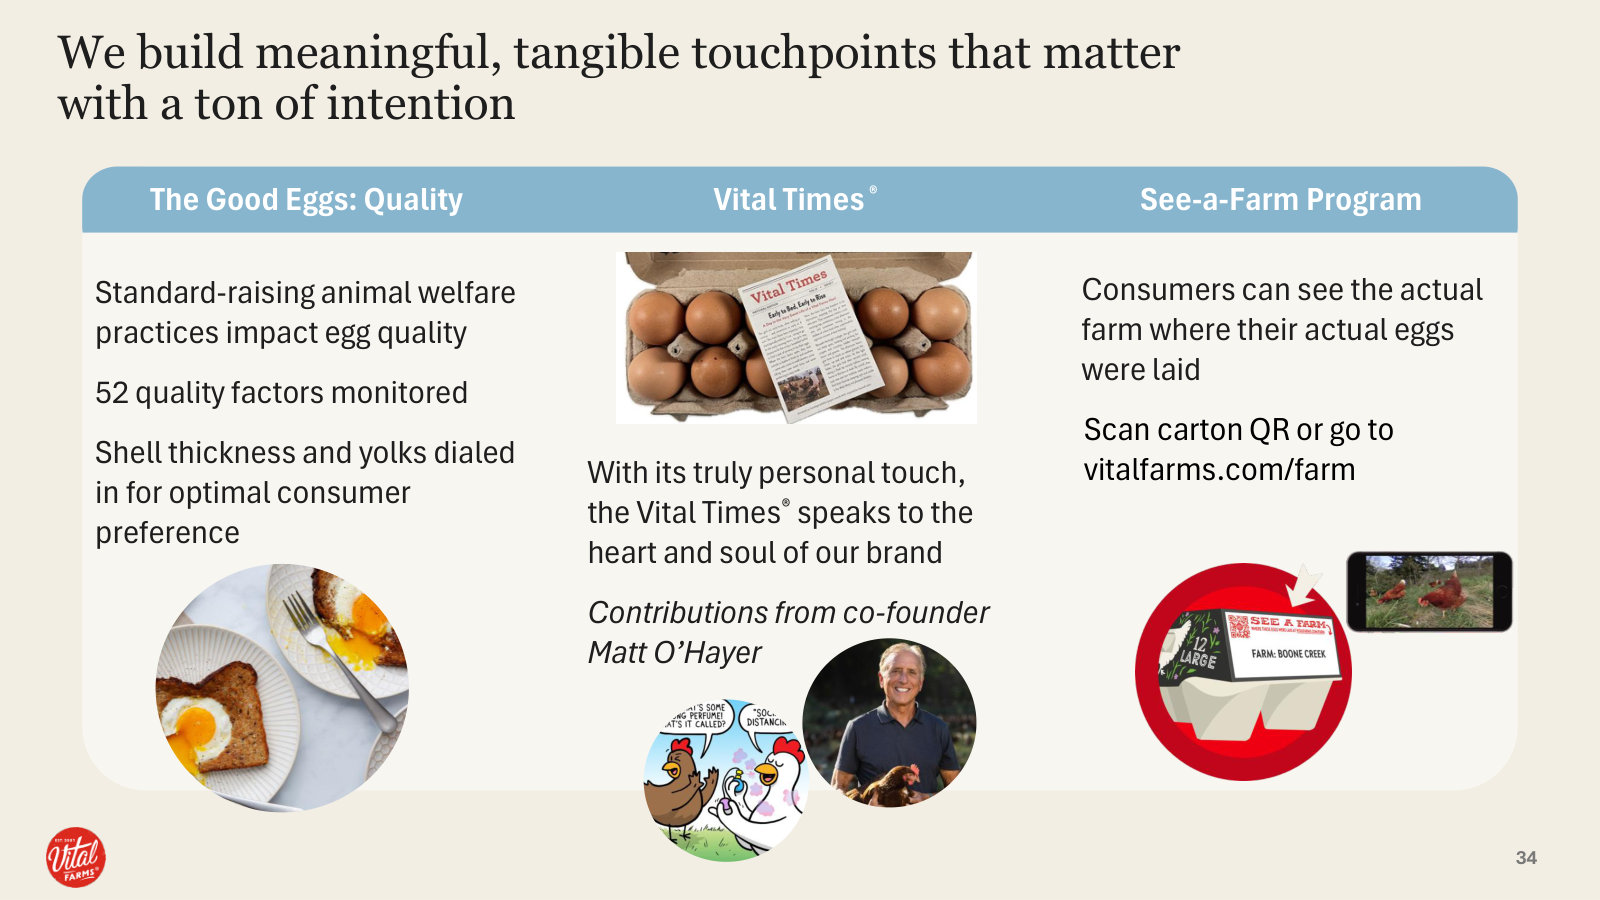
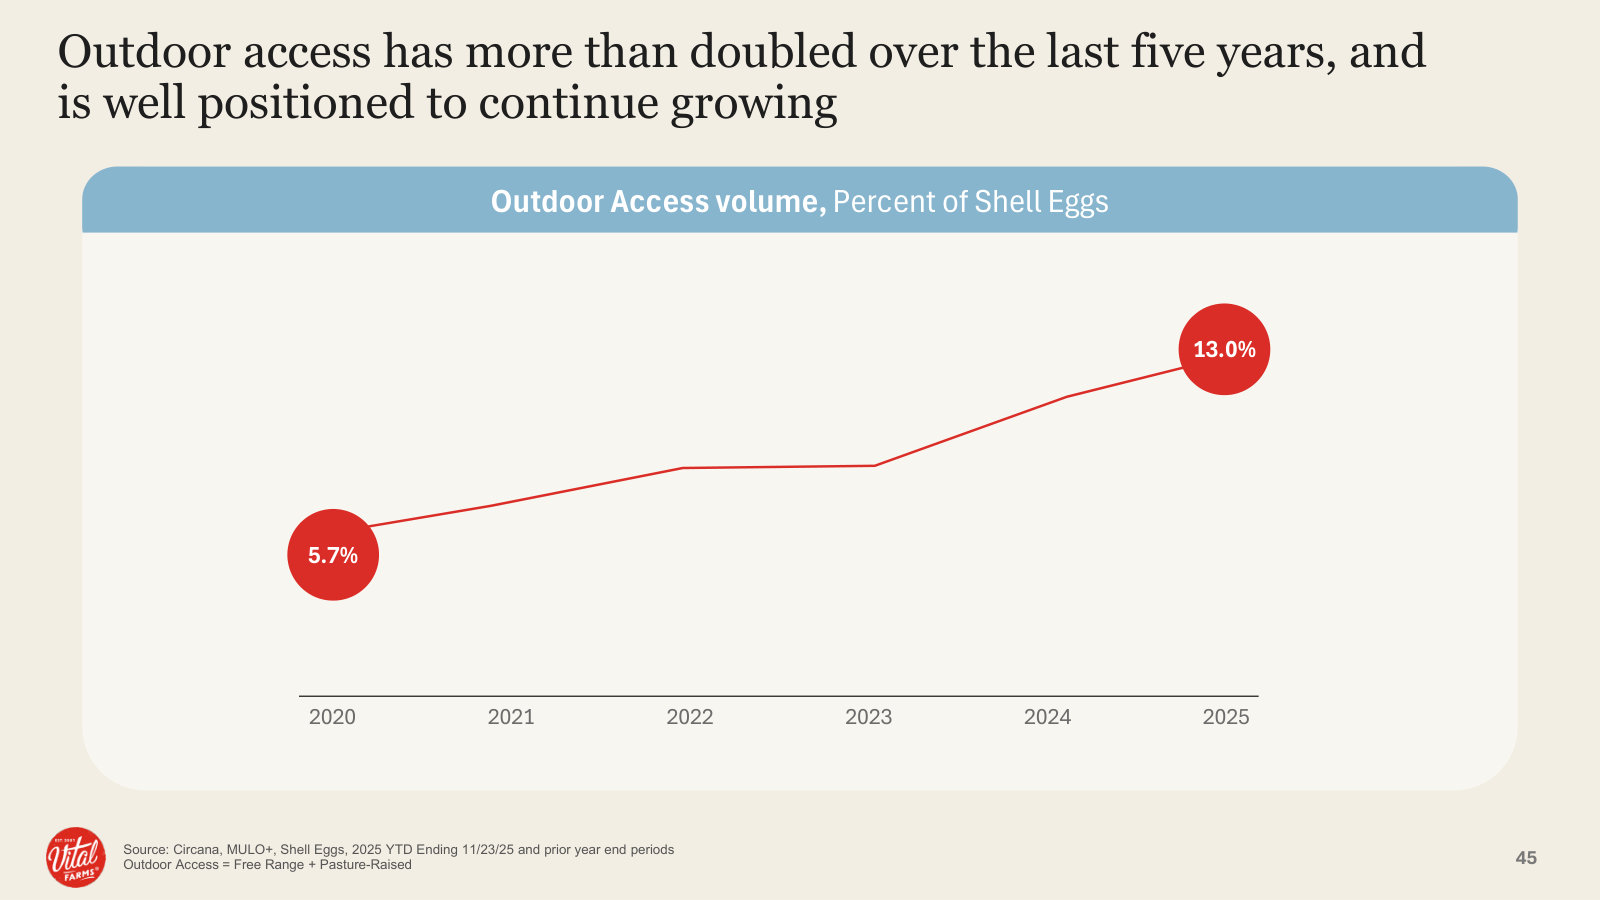
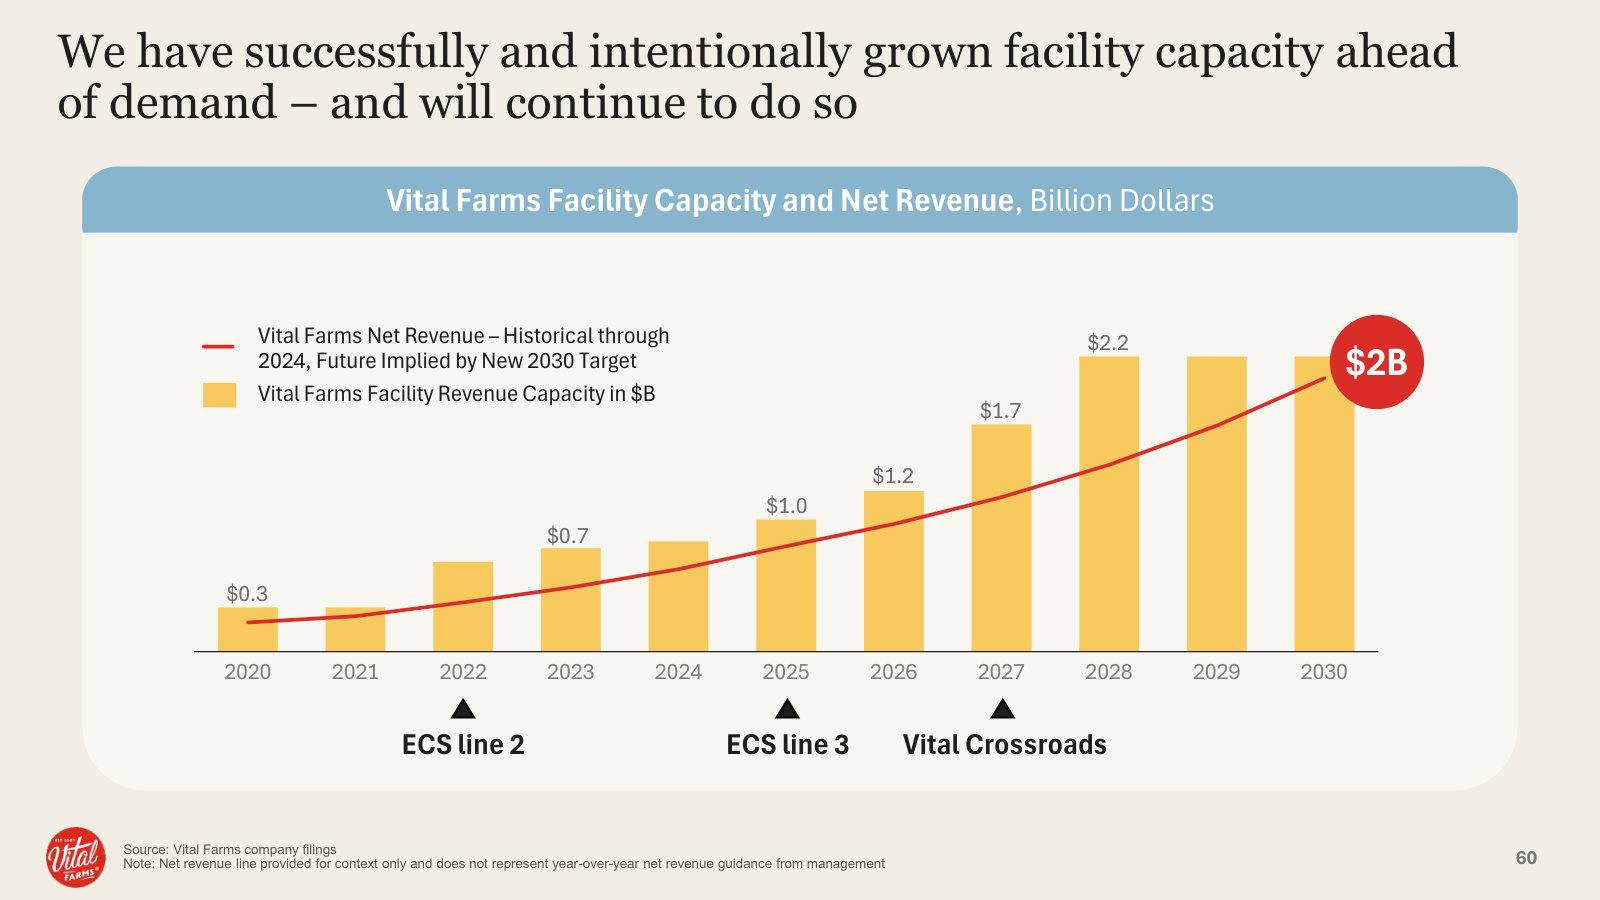
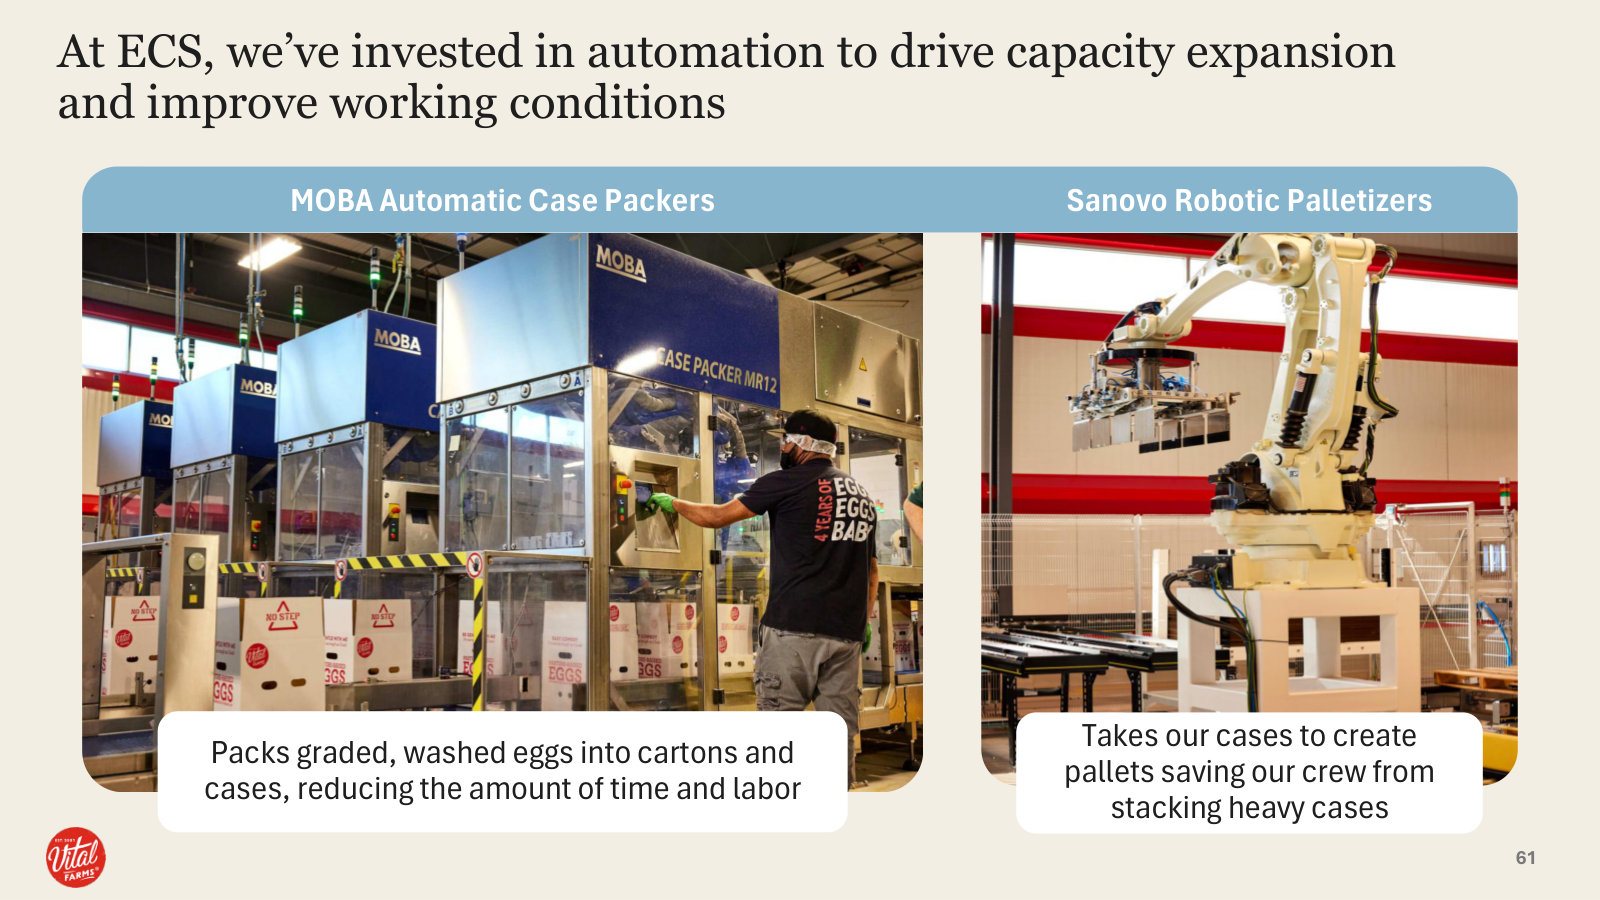
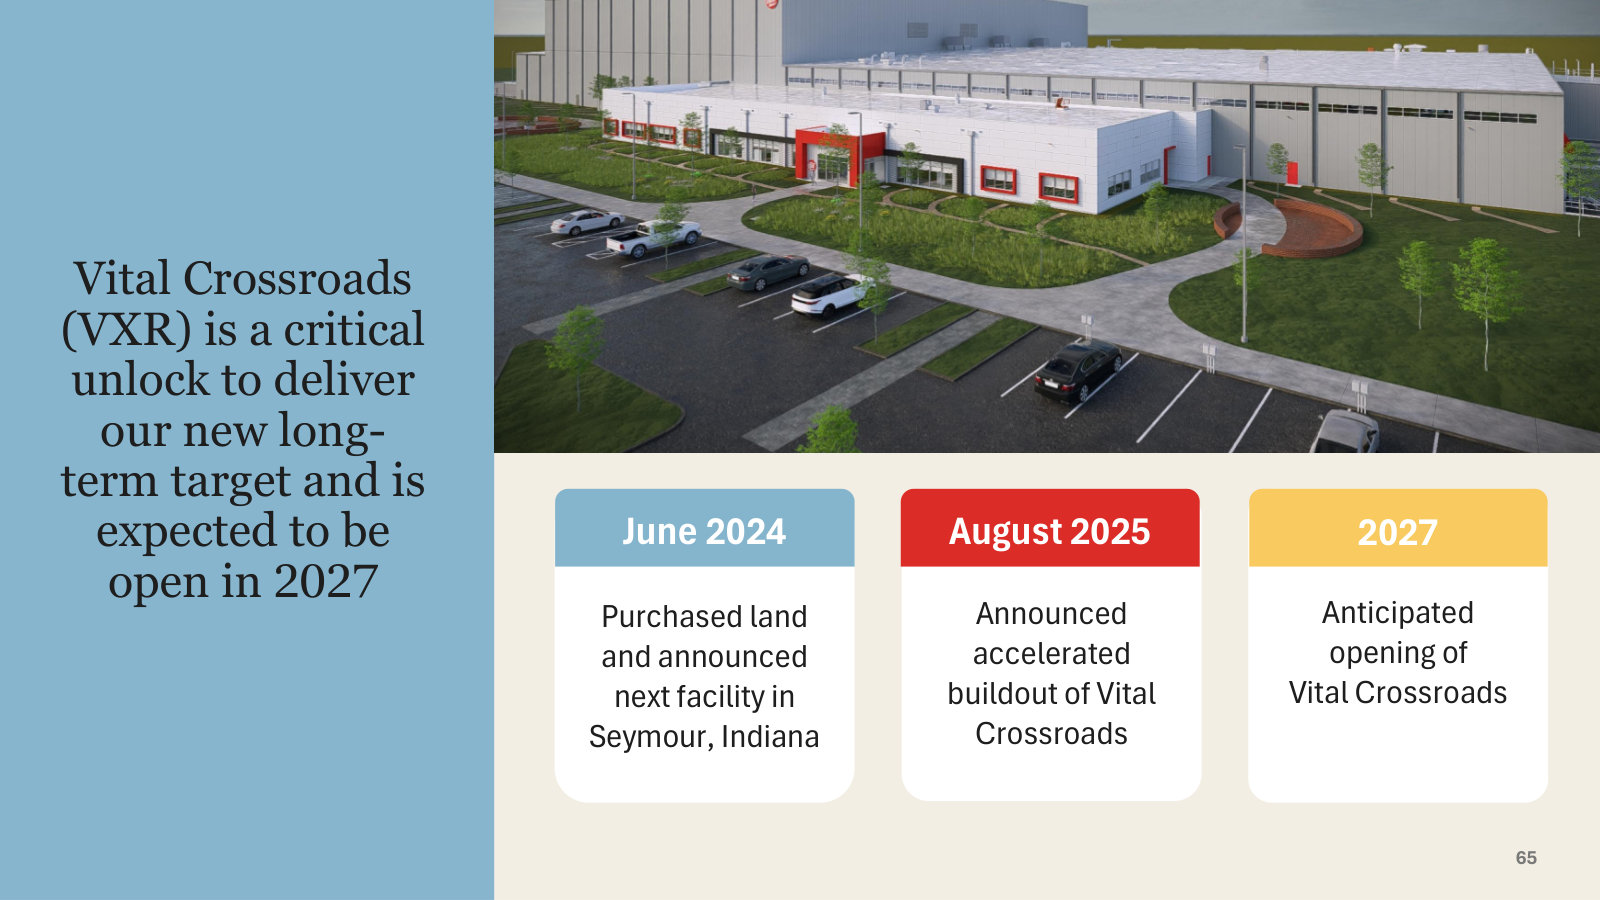
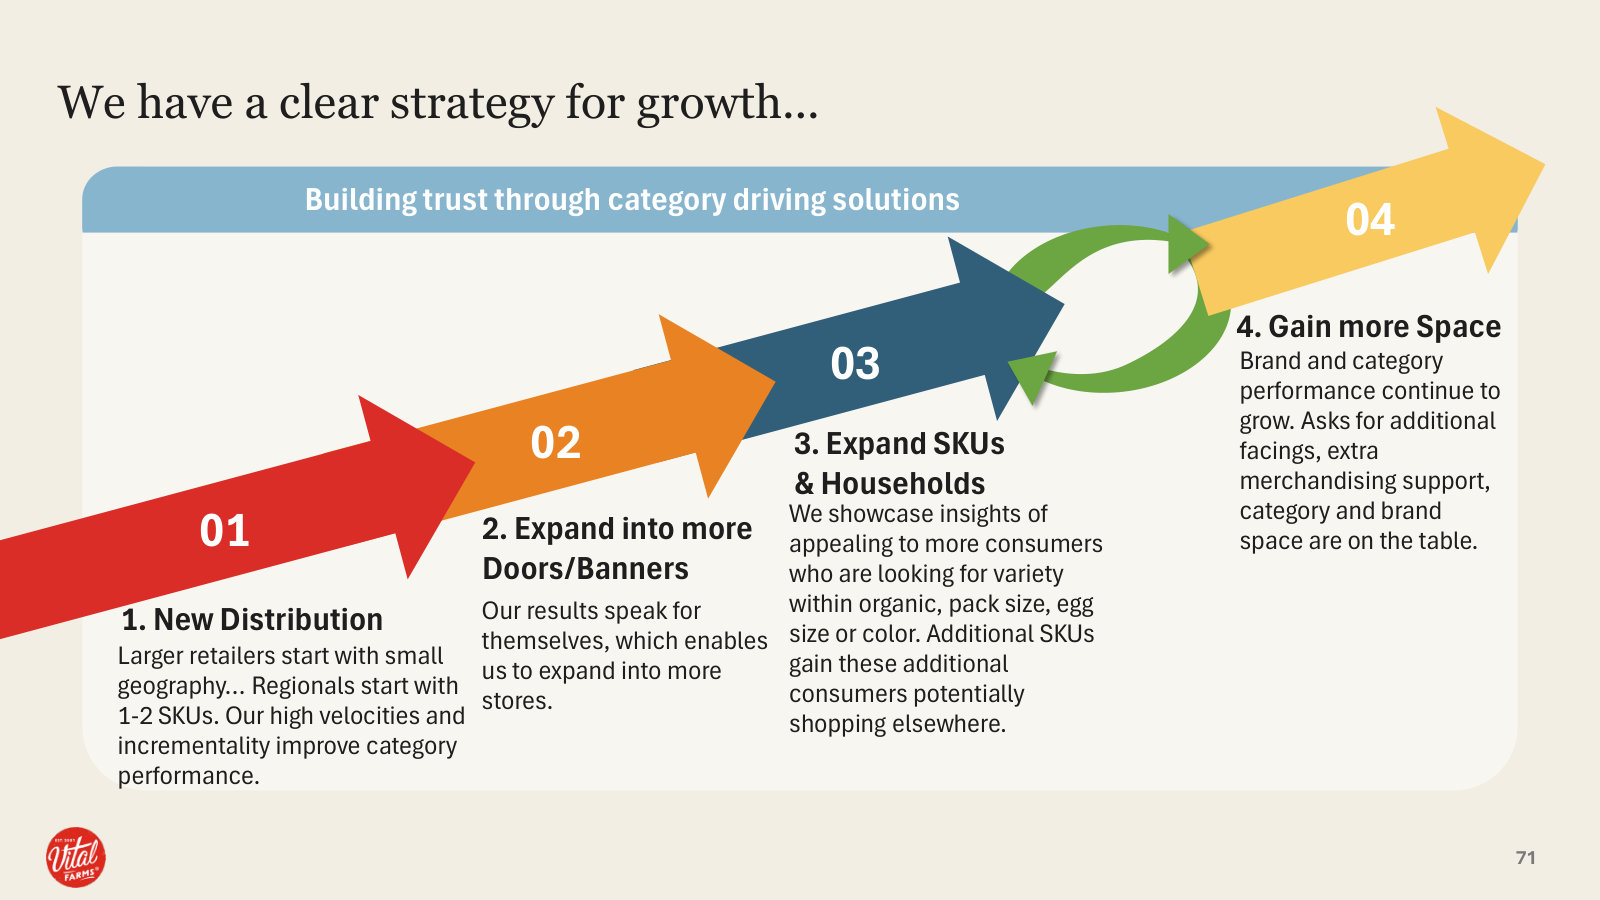
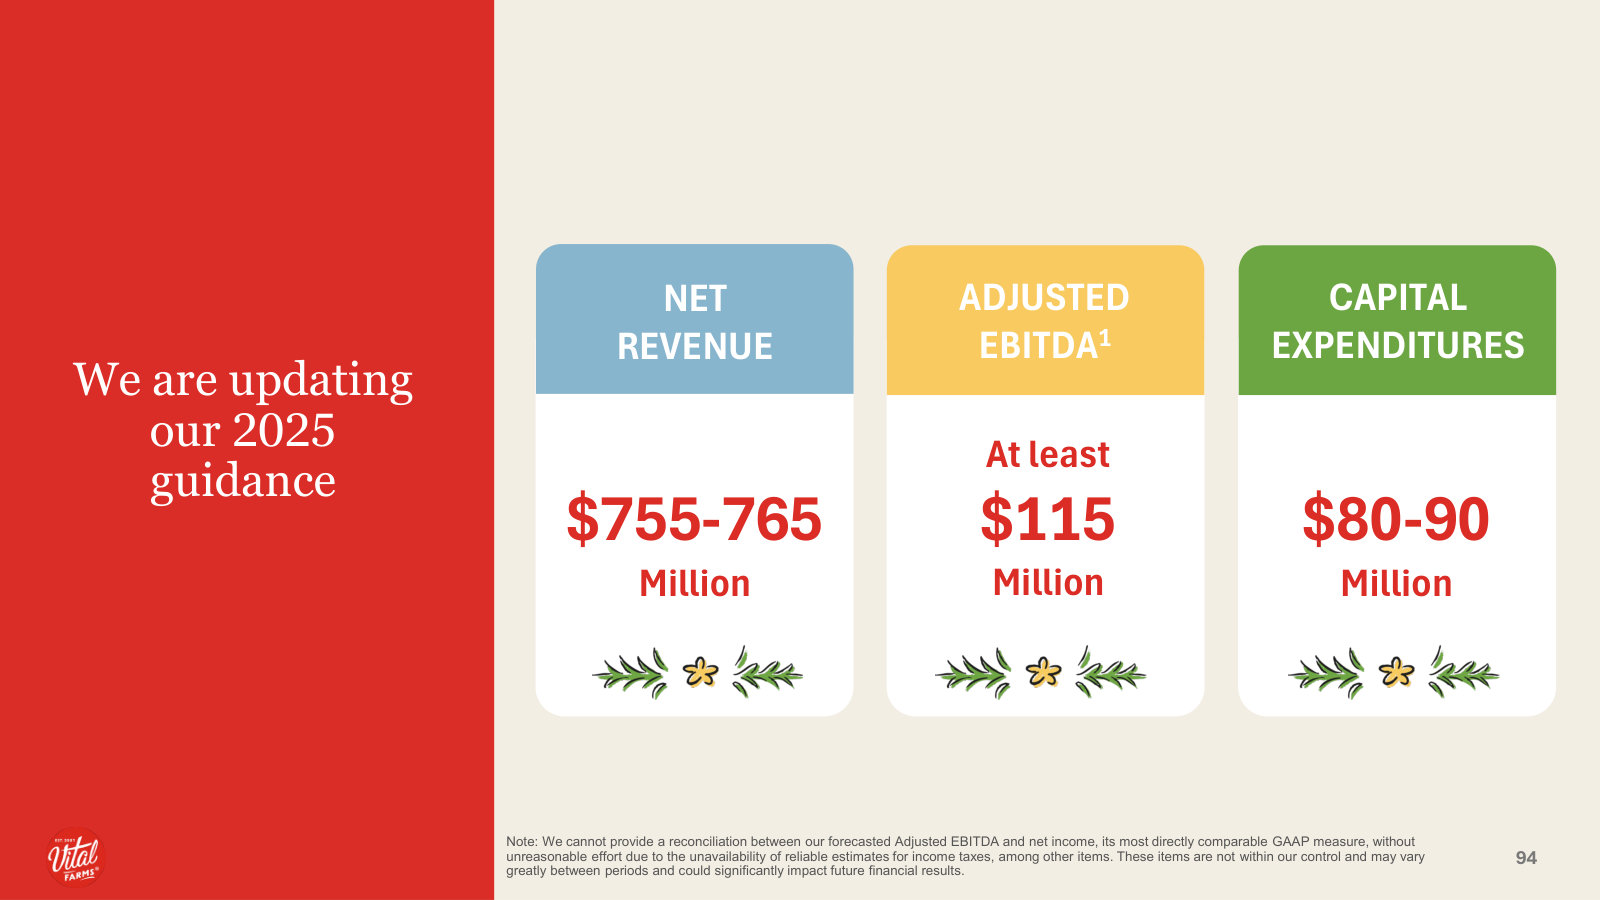
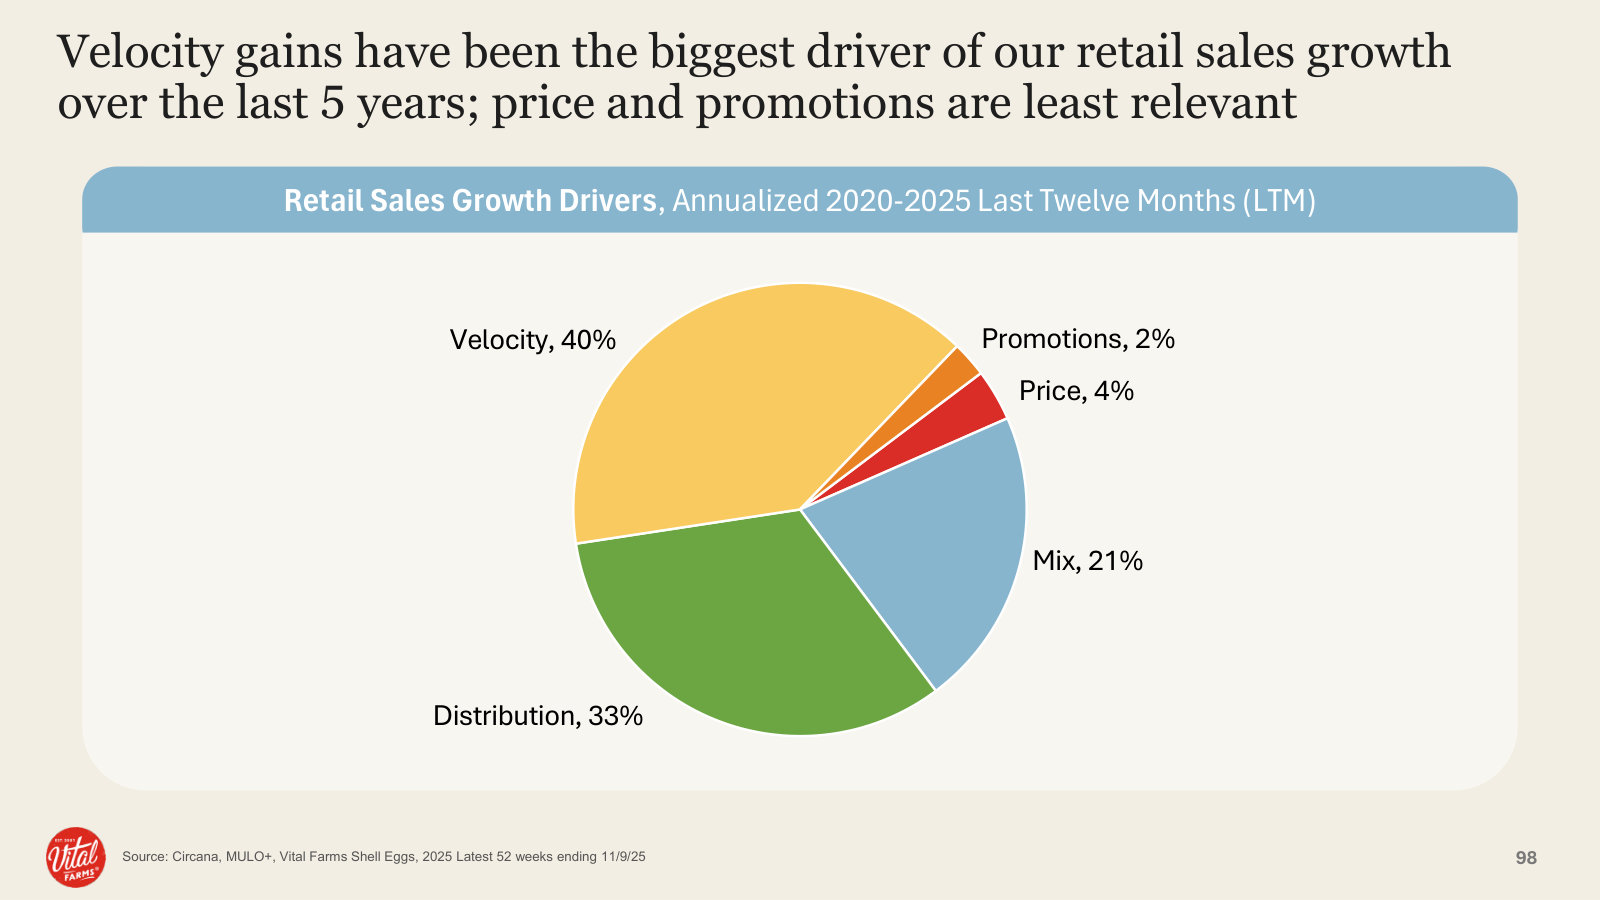
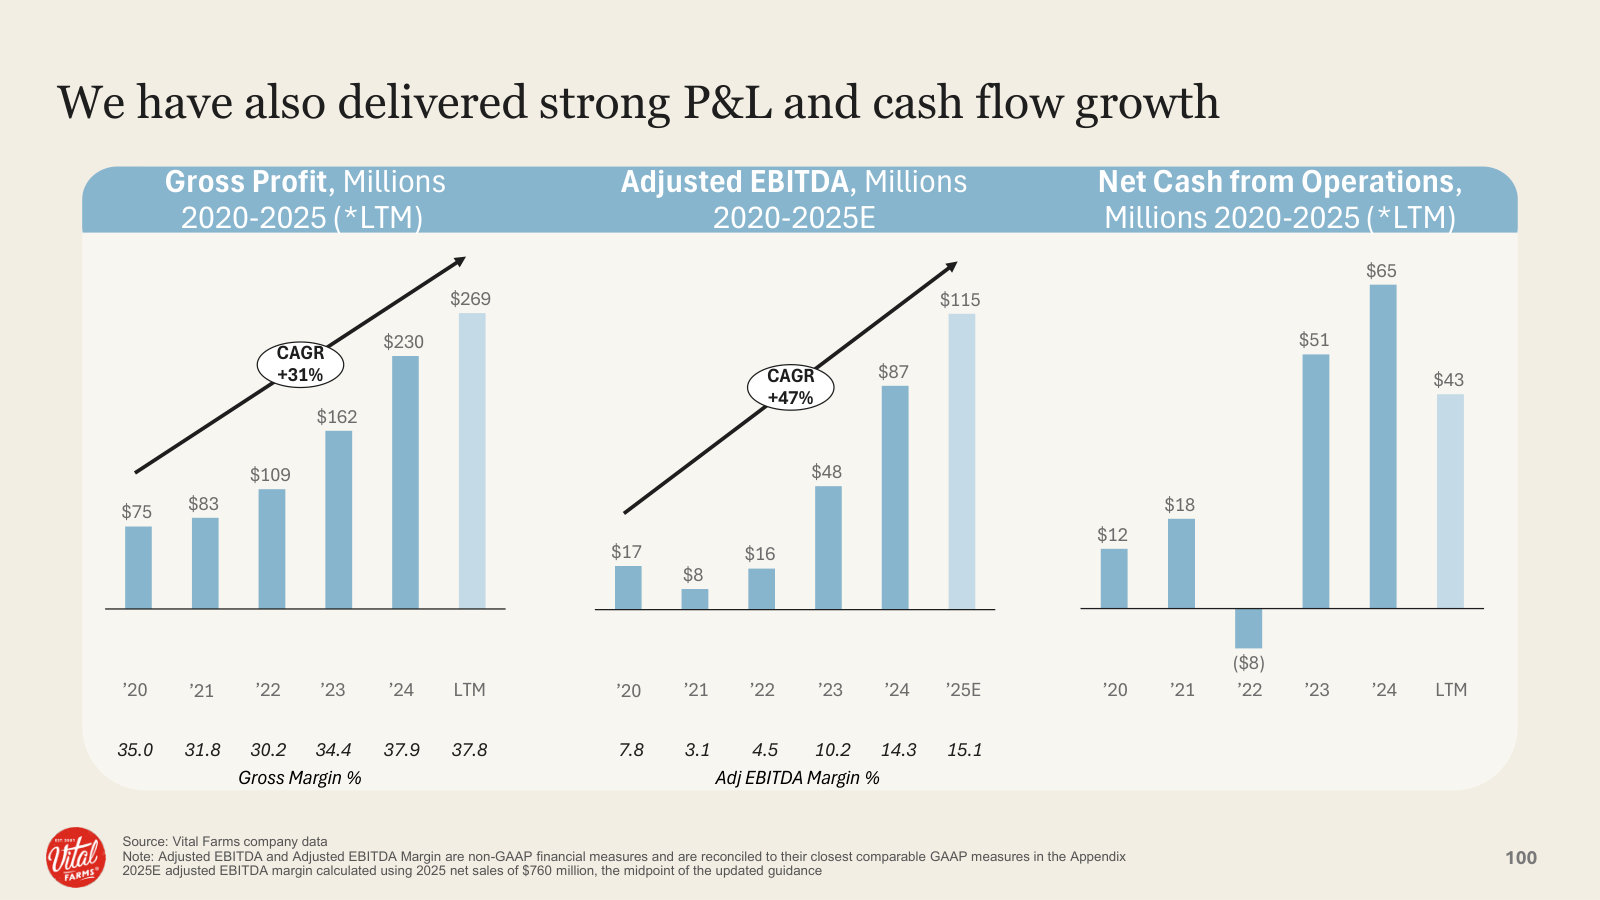
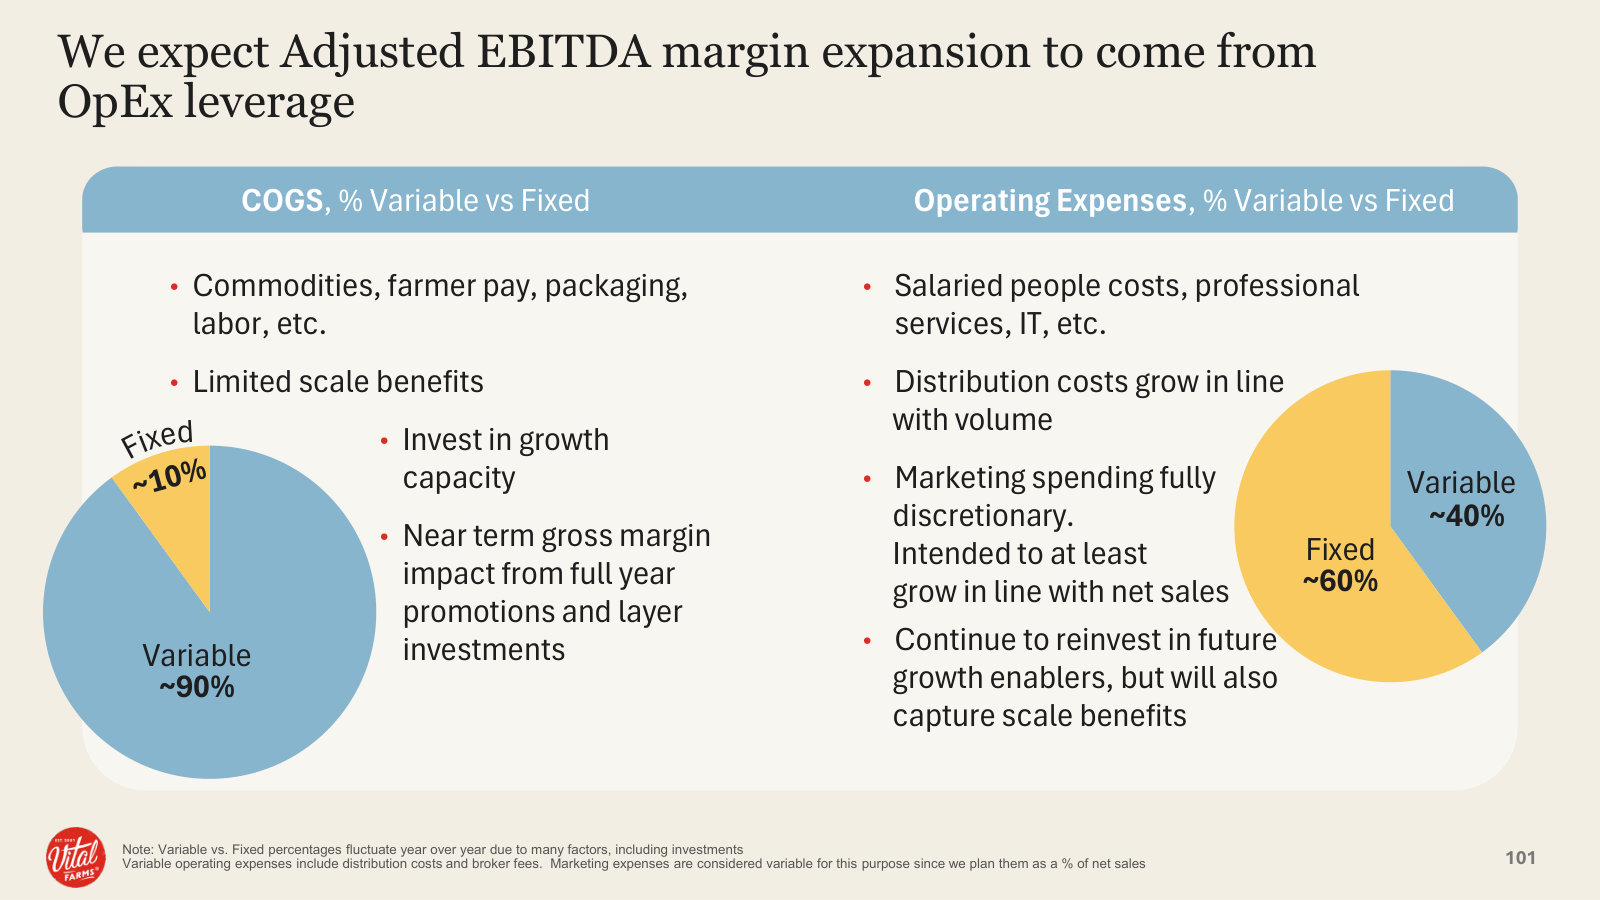
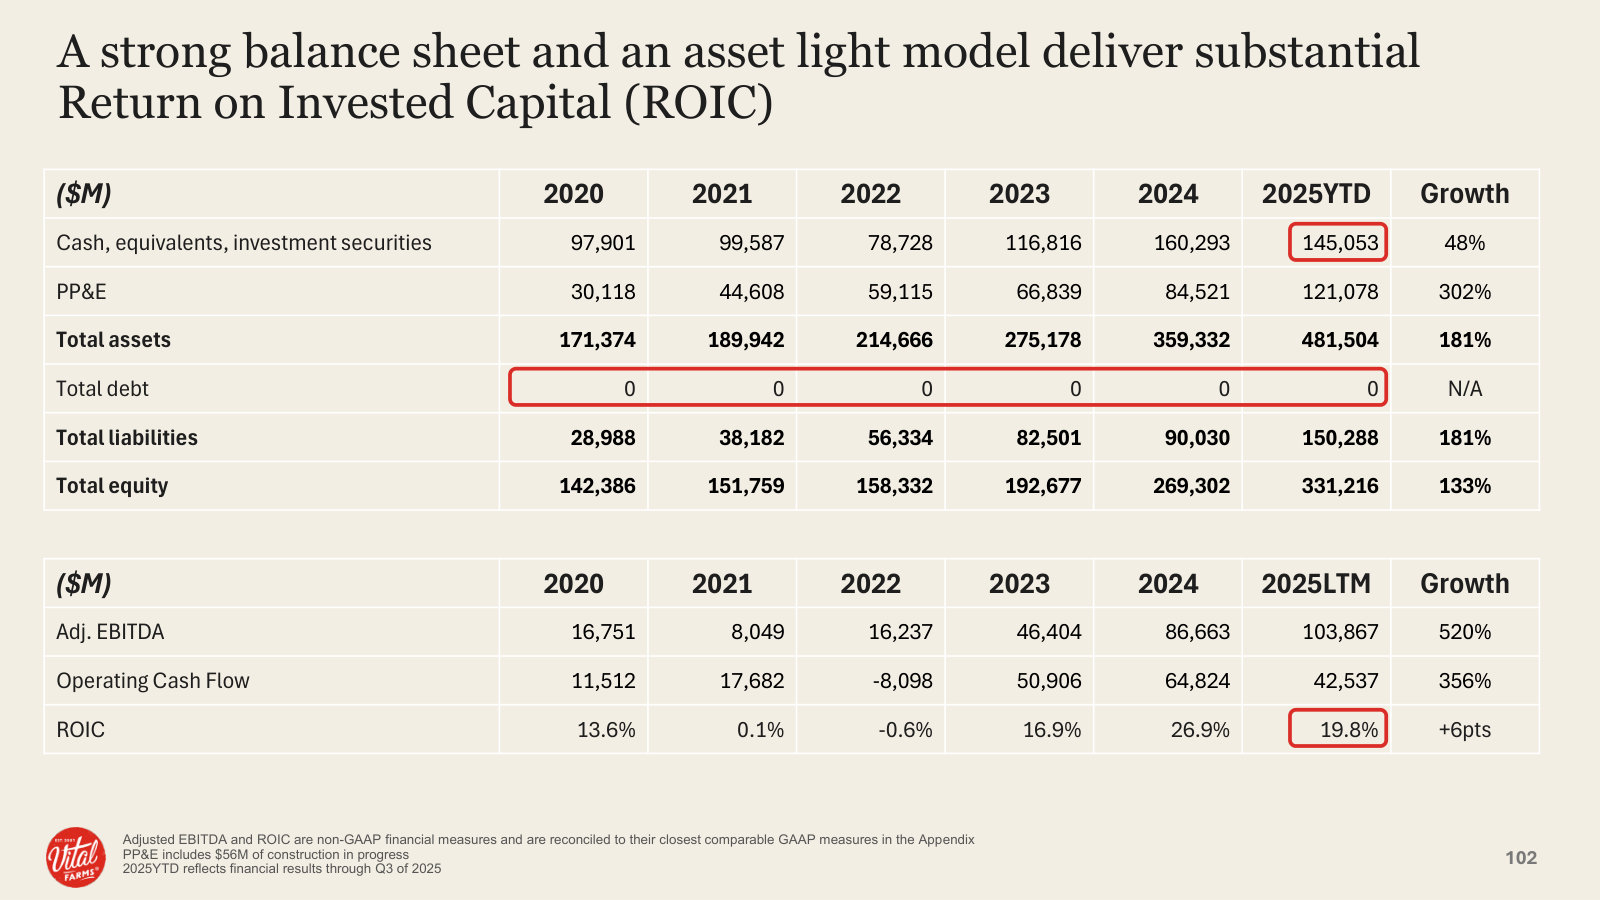
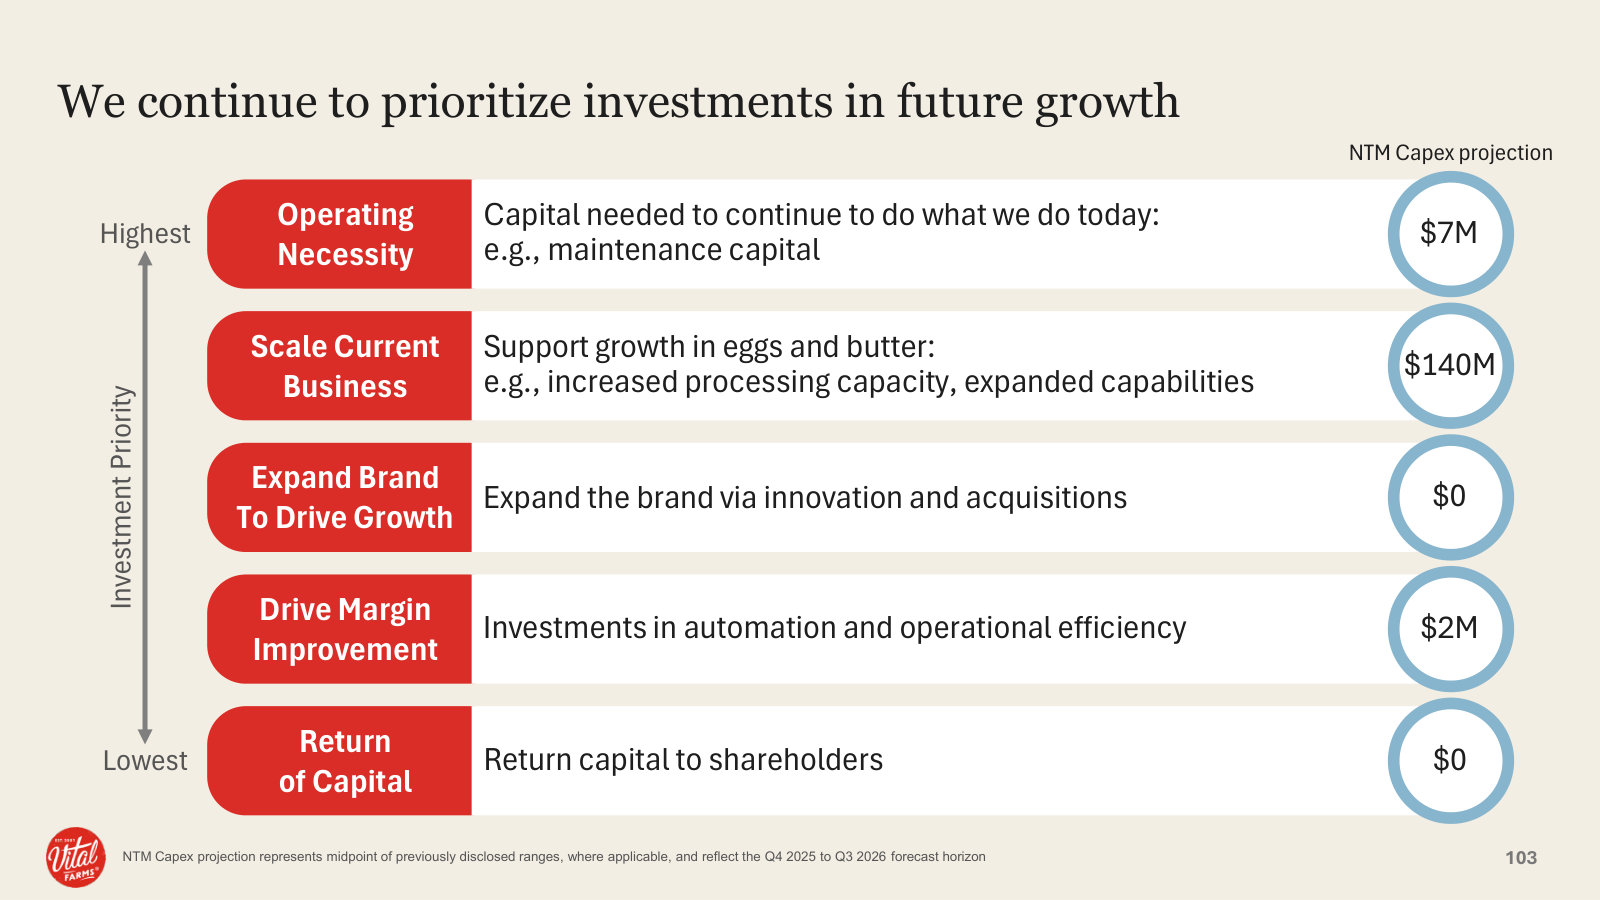
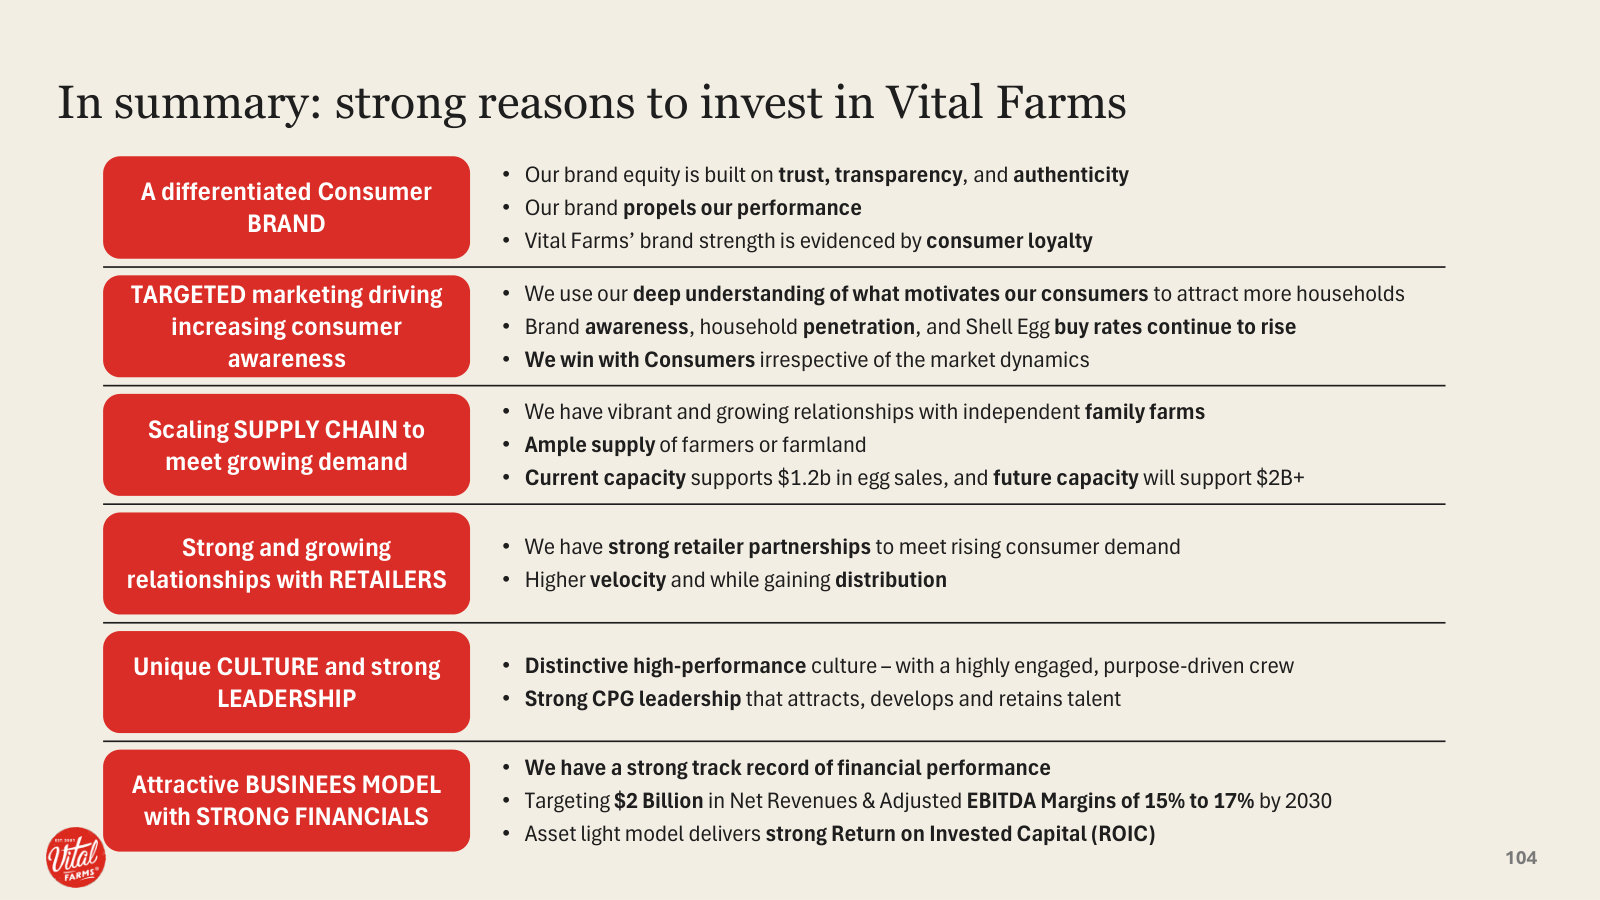
Management's fullest statement of the business — brand, farm supply, processing capacity, retail and the 2030 plan to reach $2B in revenue. · Open the full document →
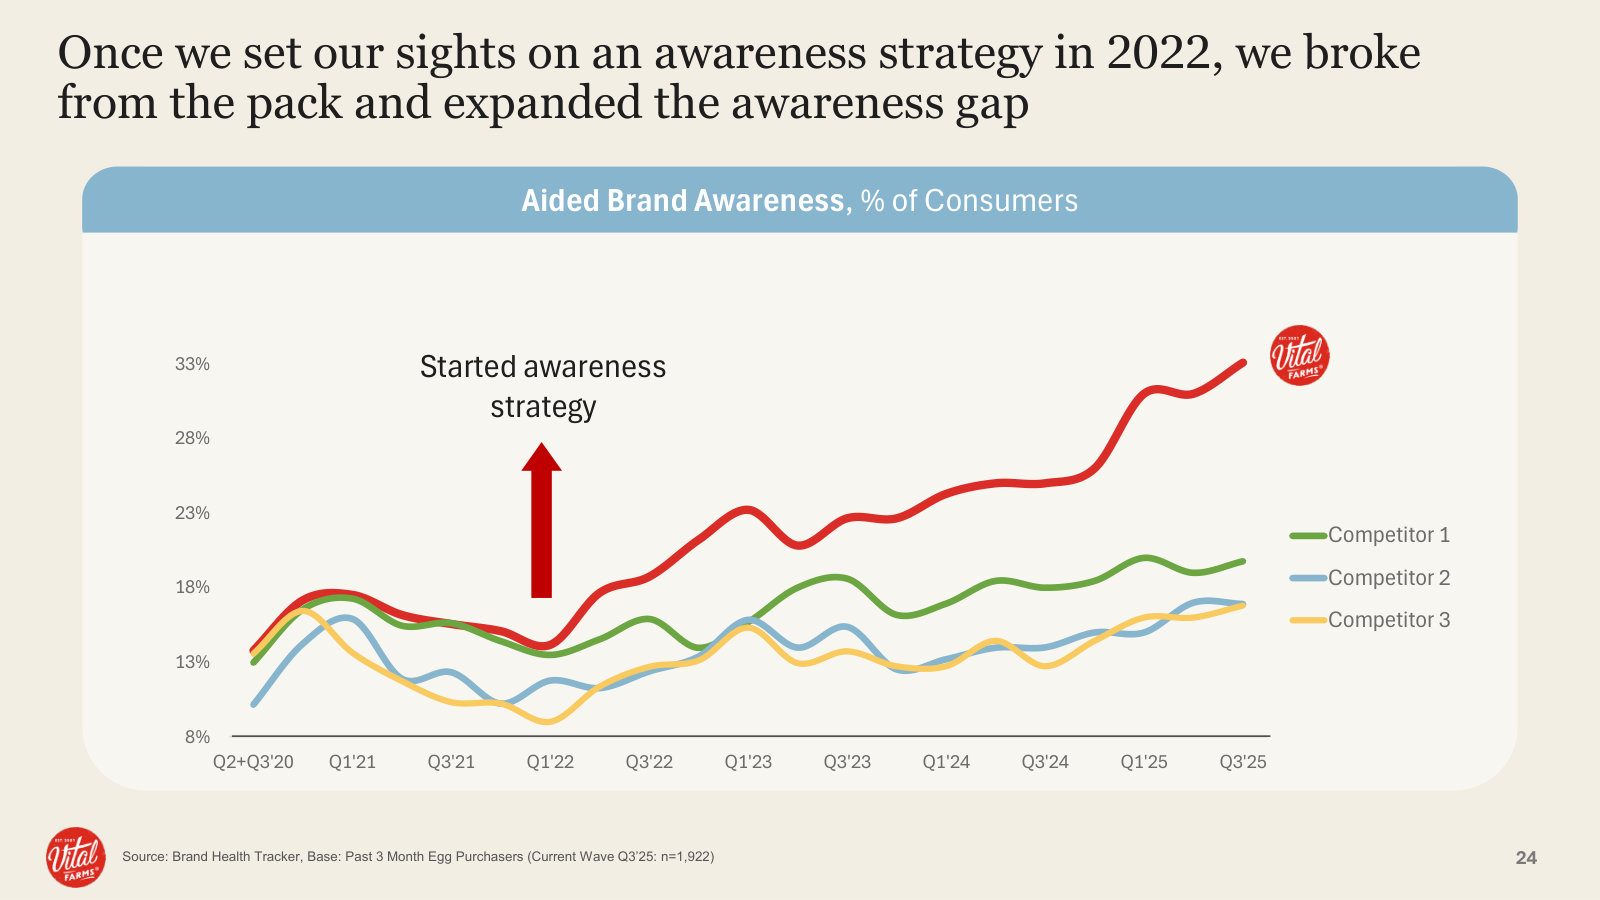
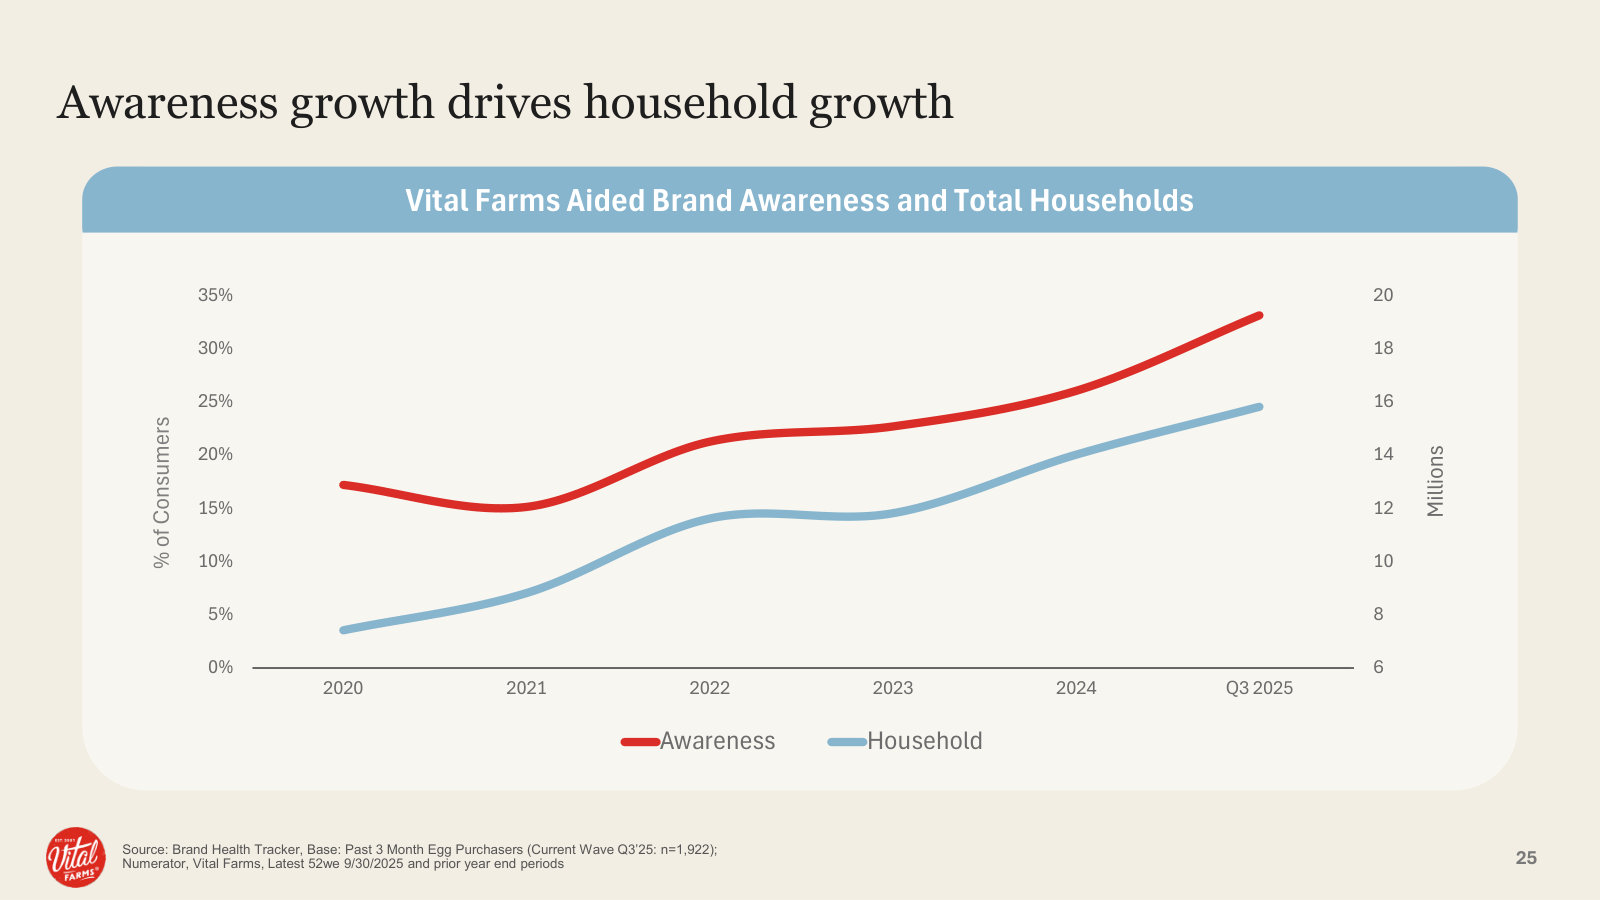
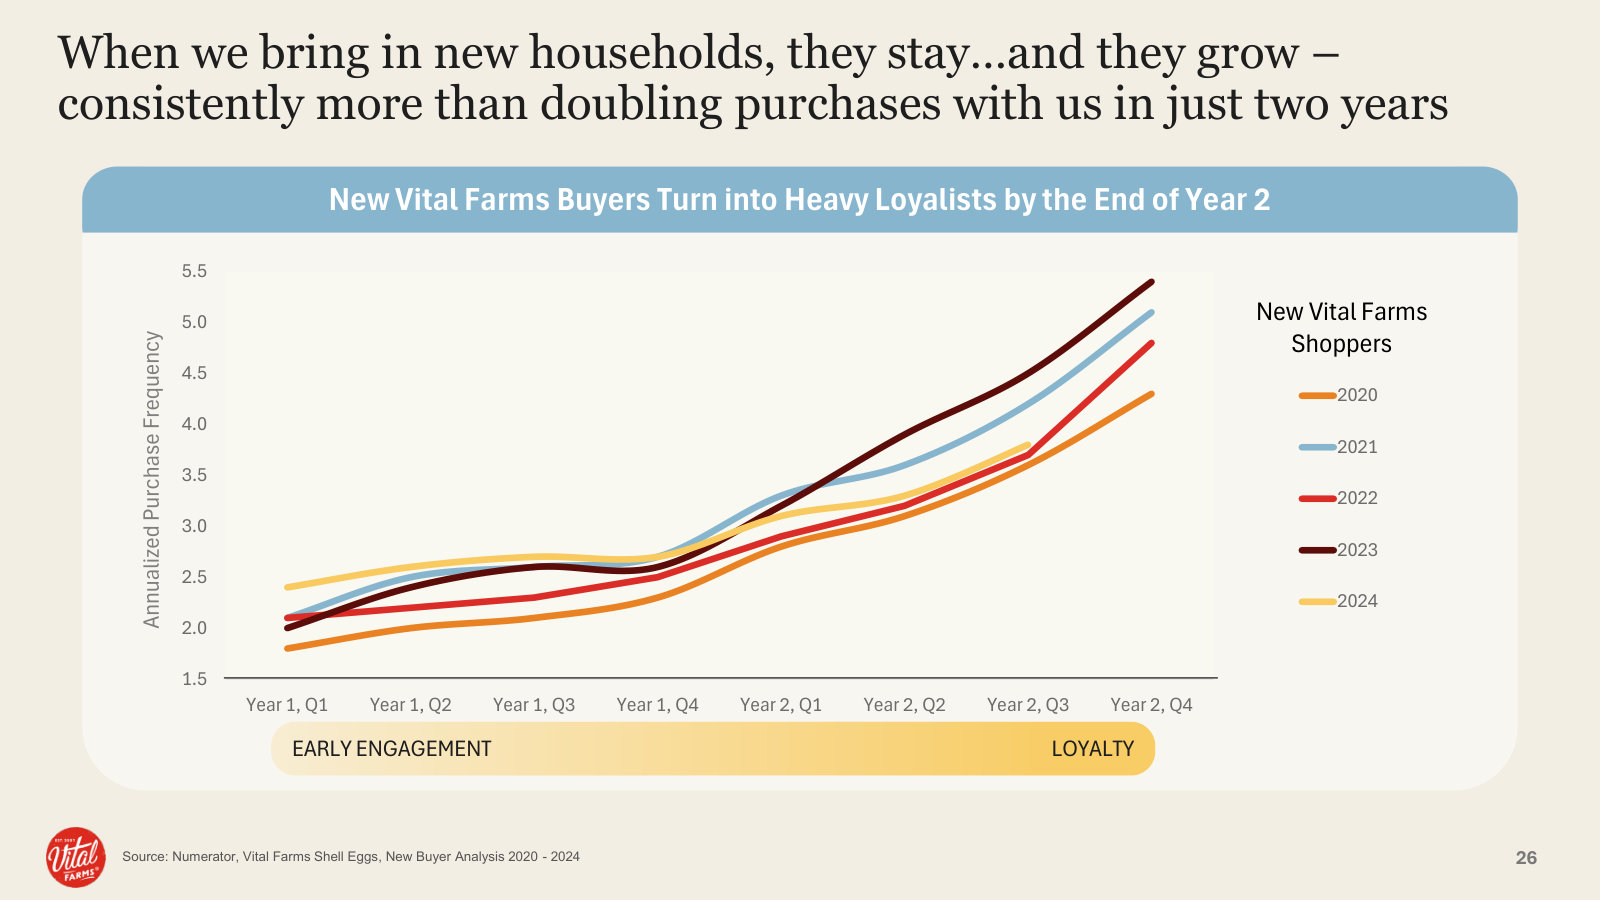
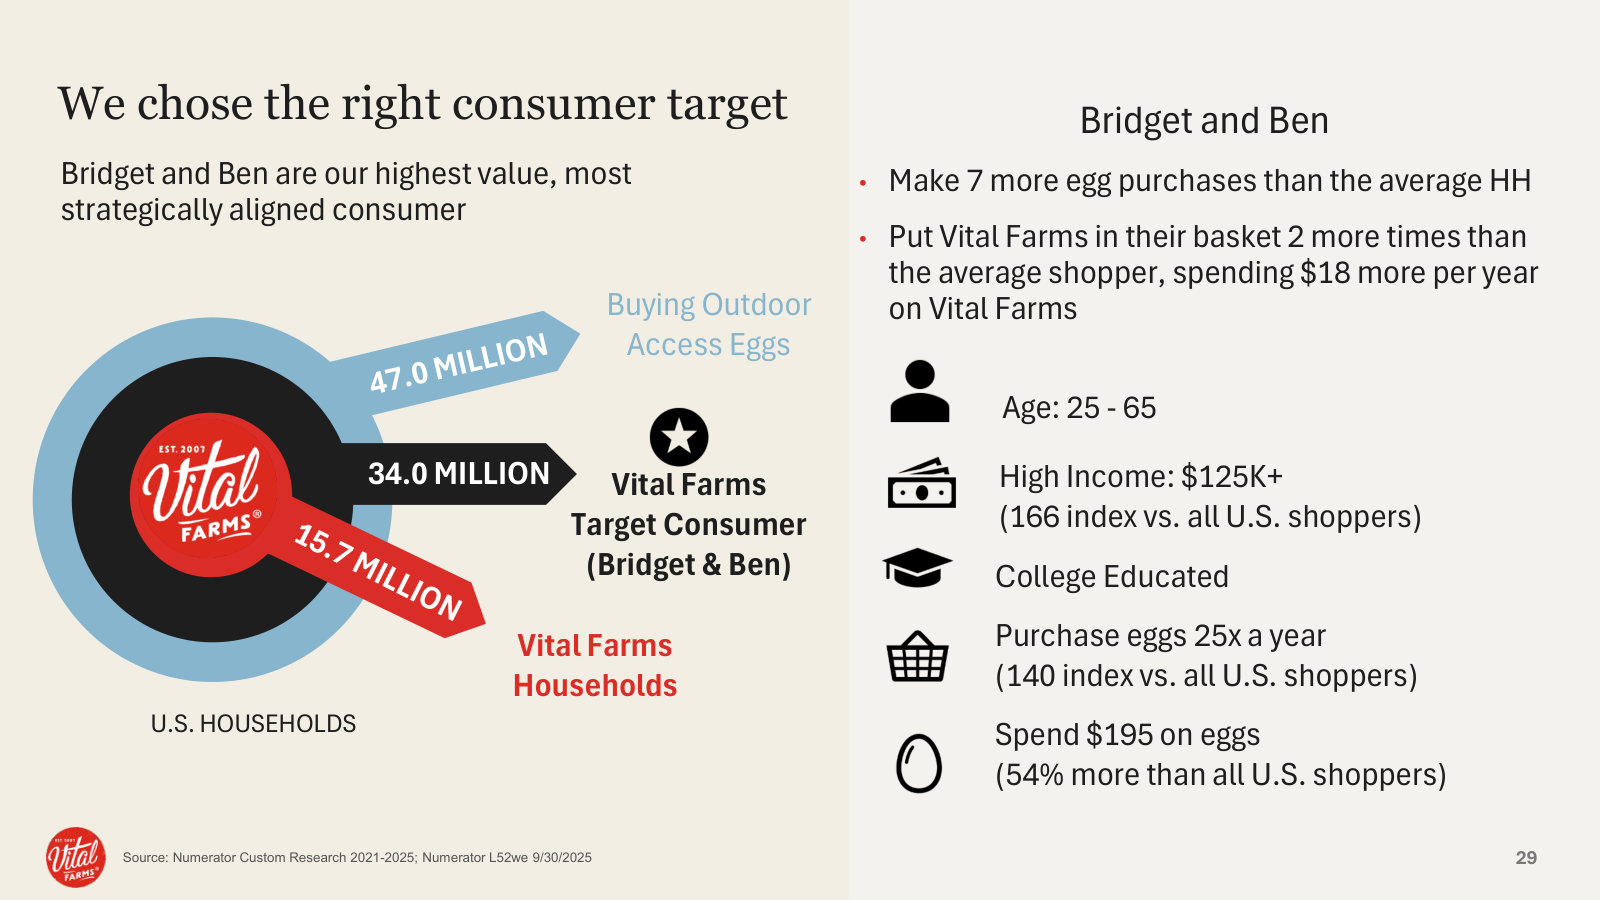
Q1 2026 Investor Presentation — Q1 2026
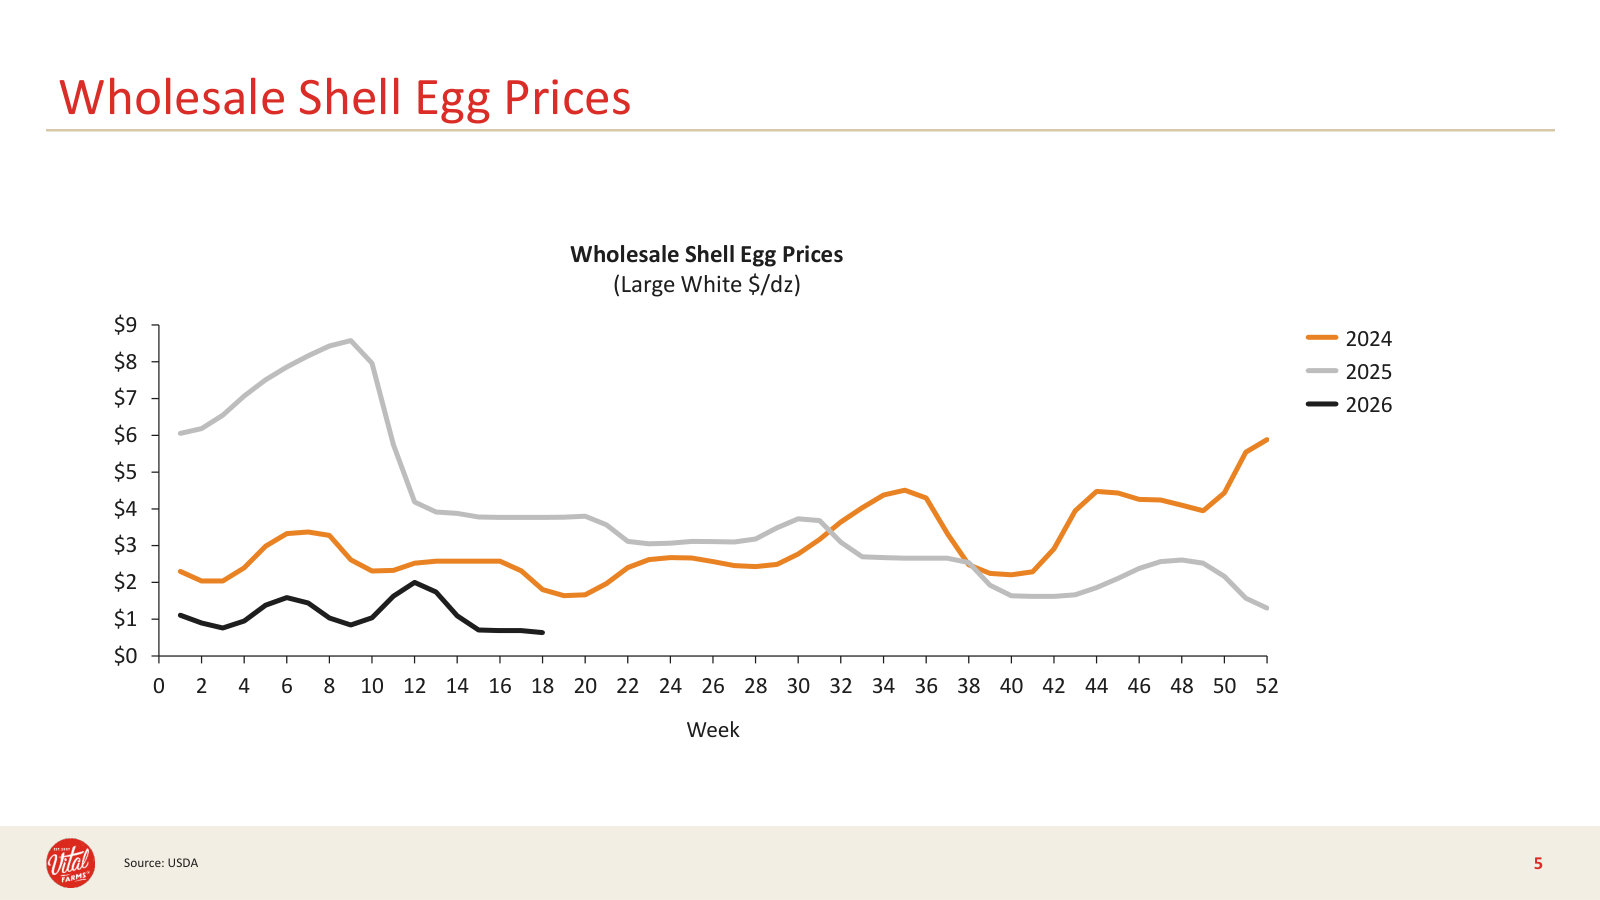
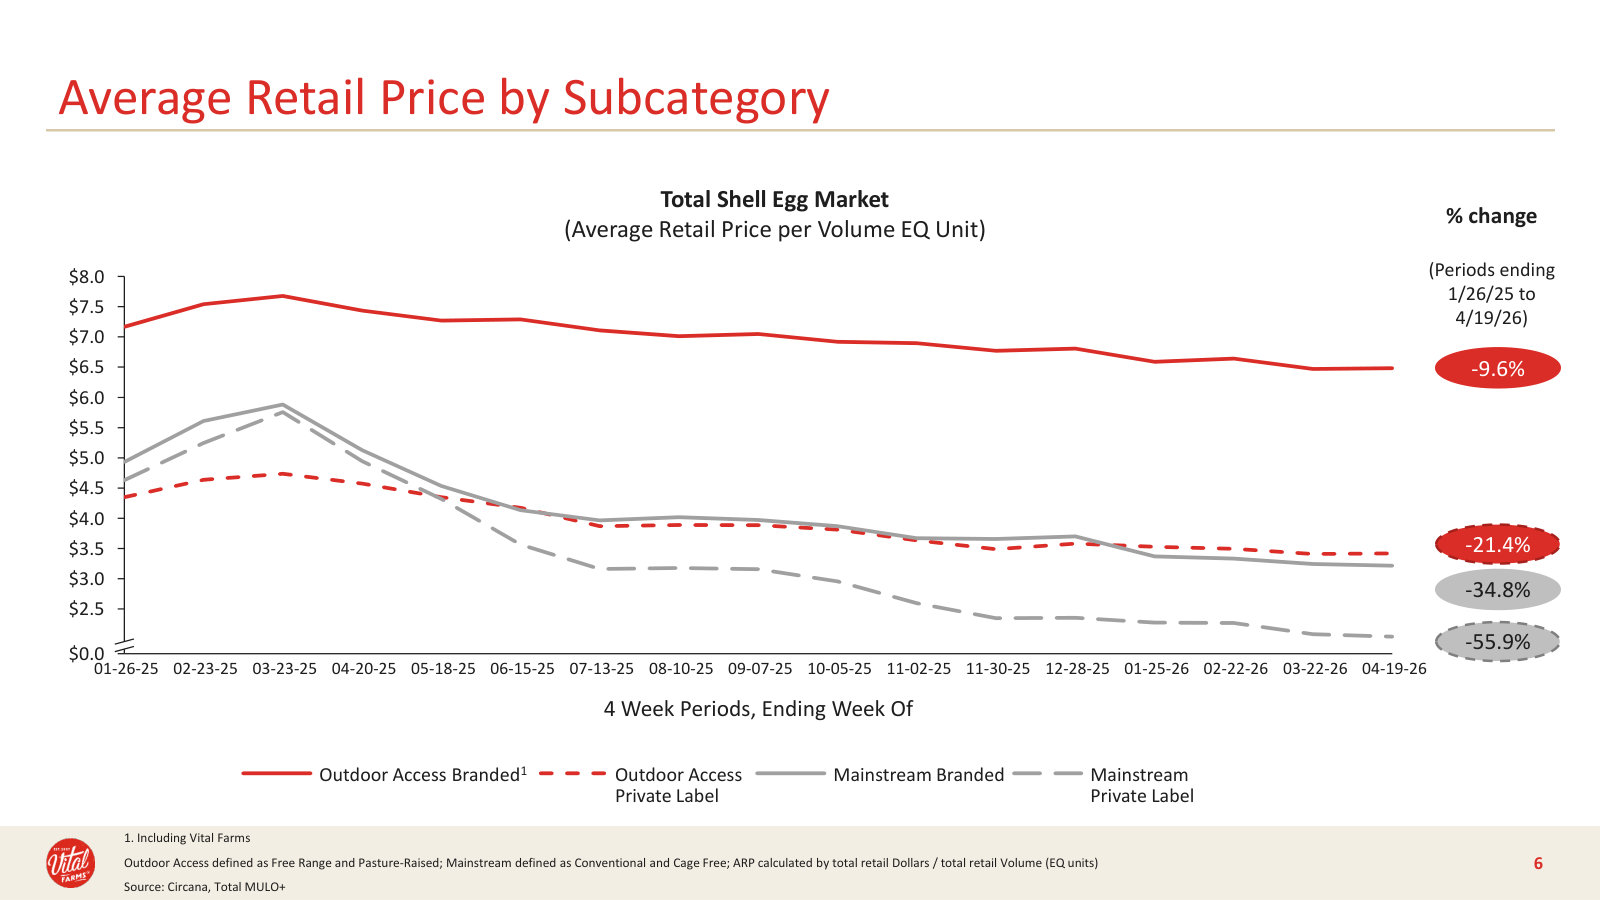
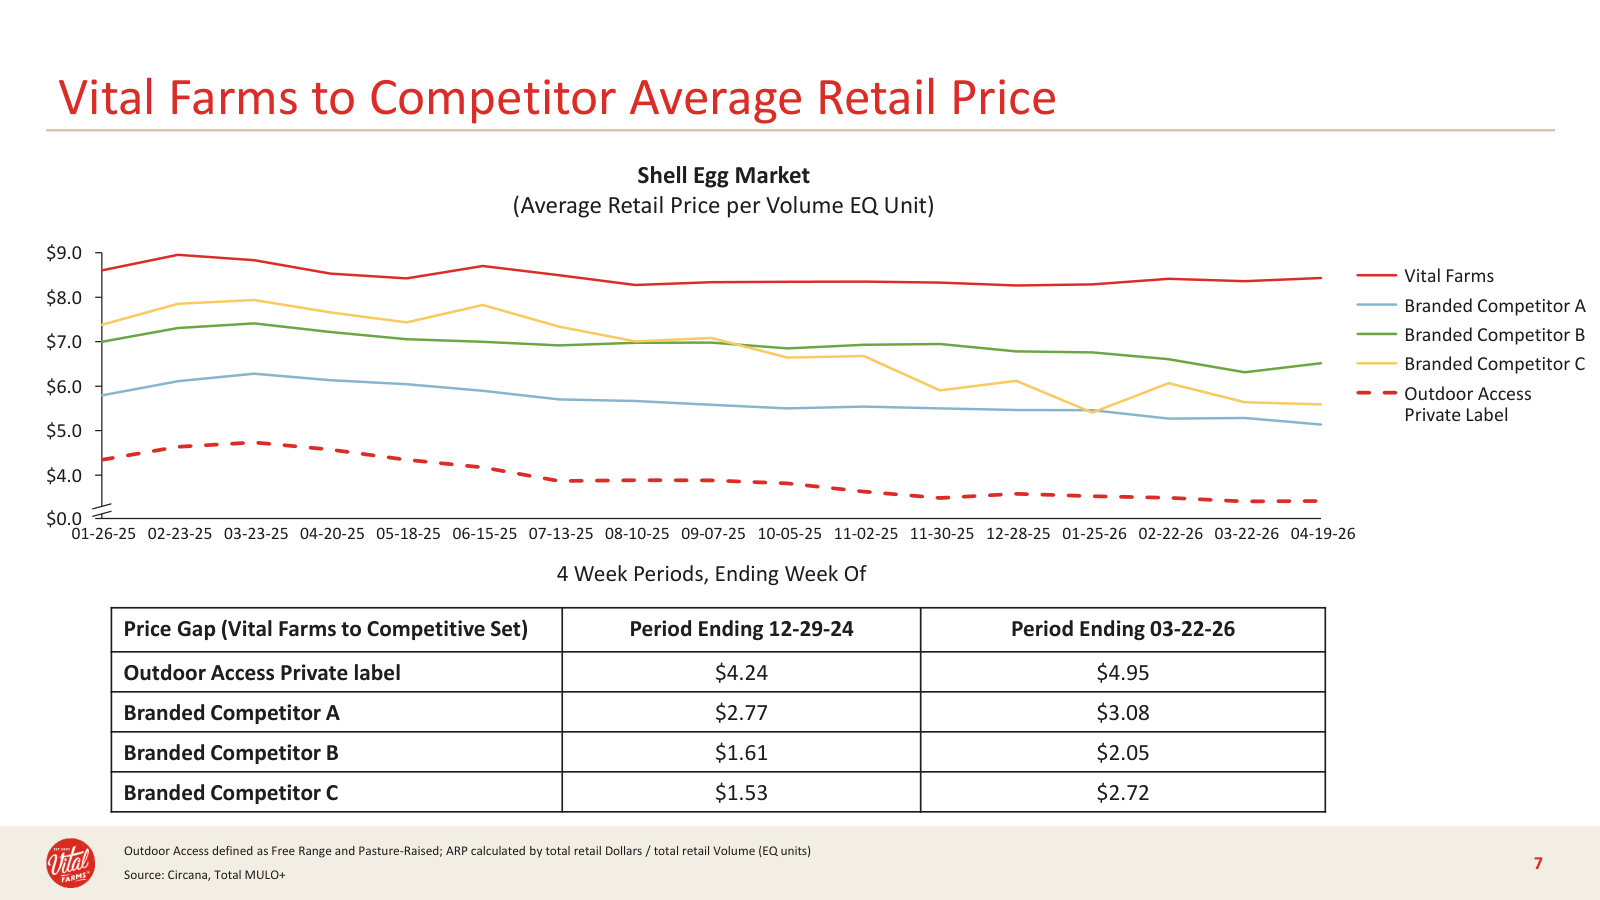
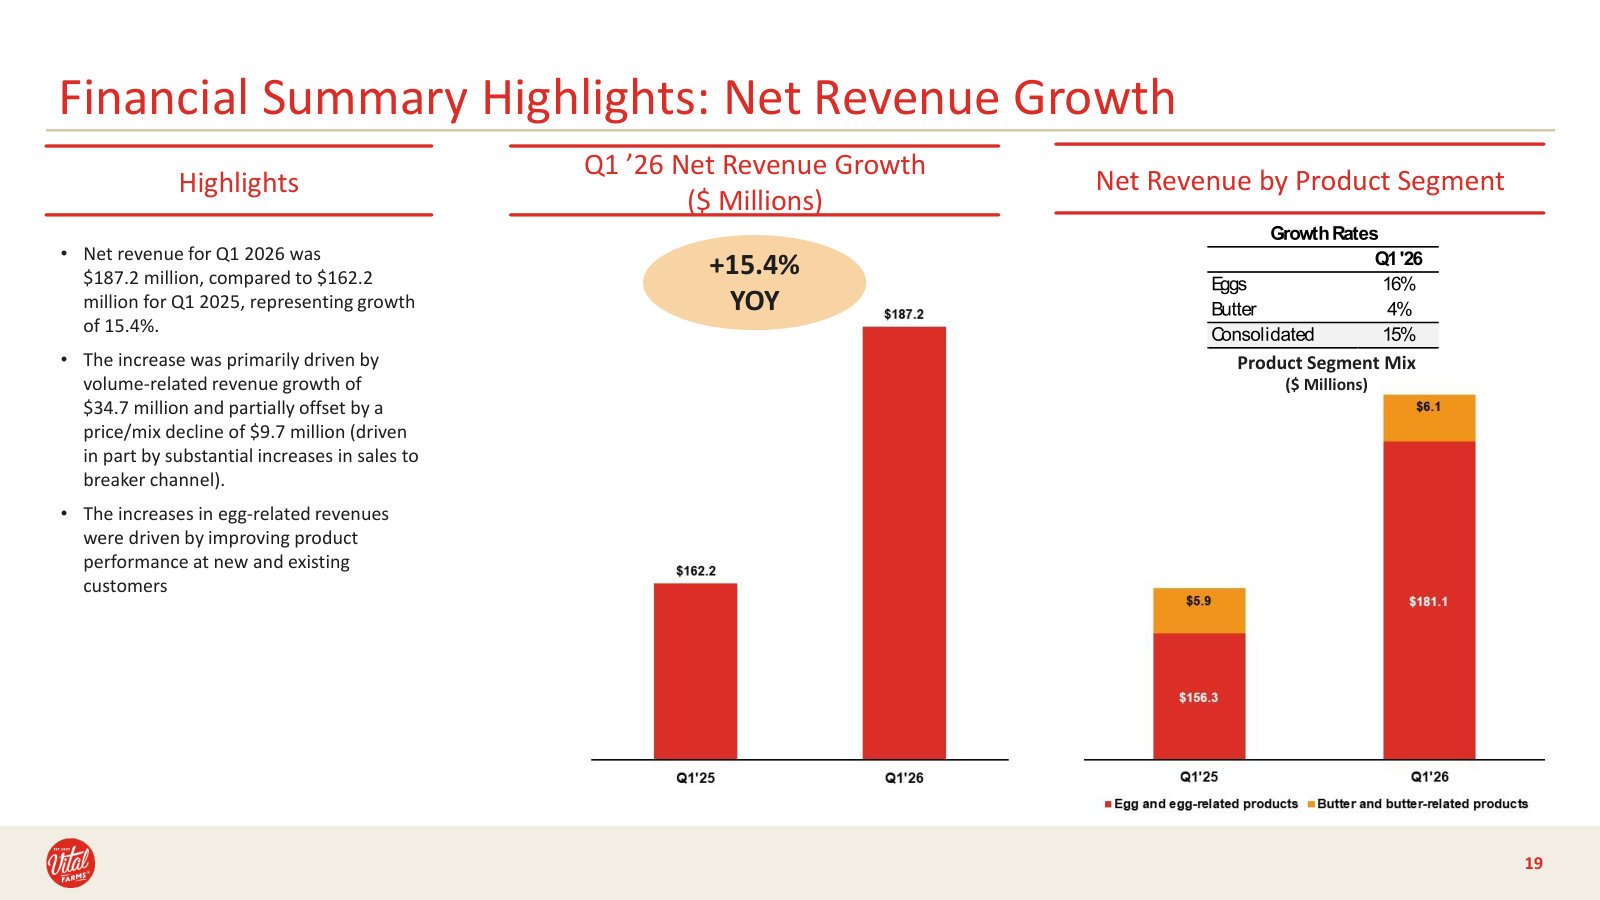
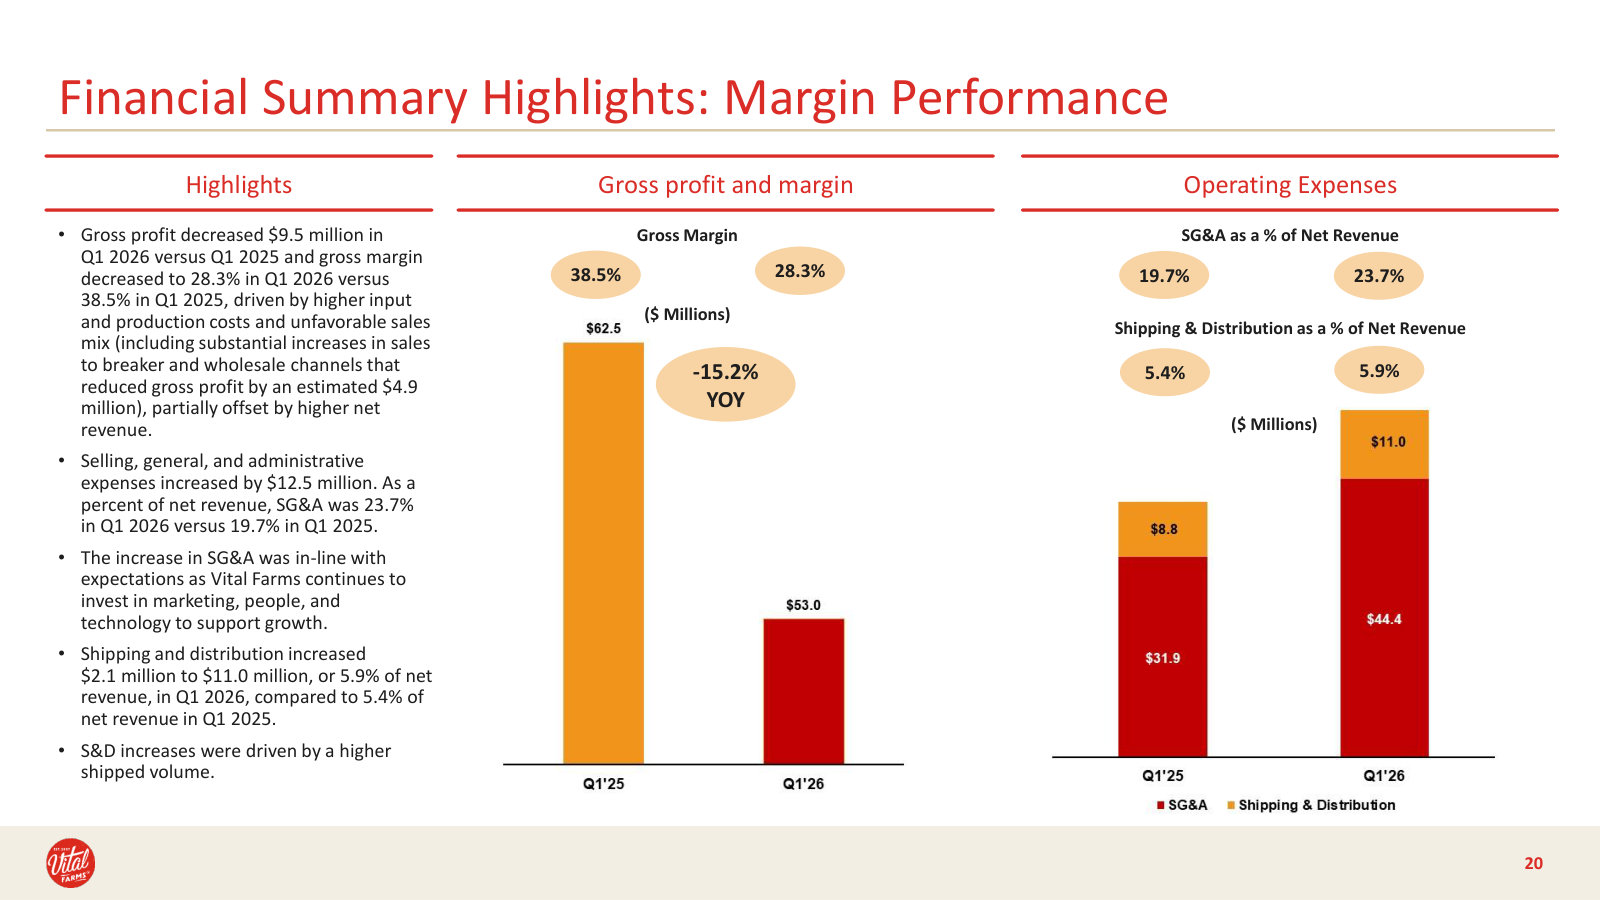
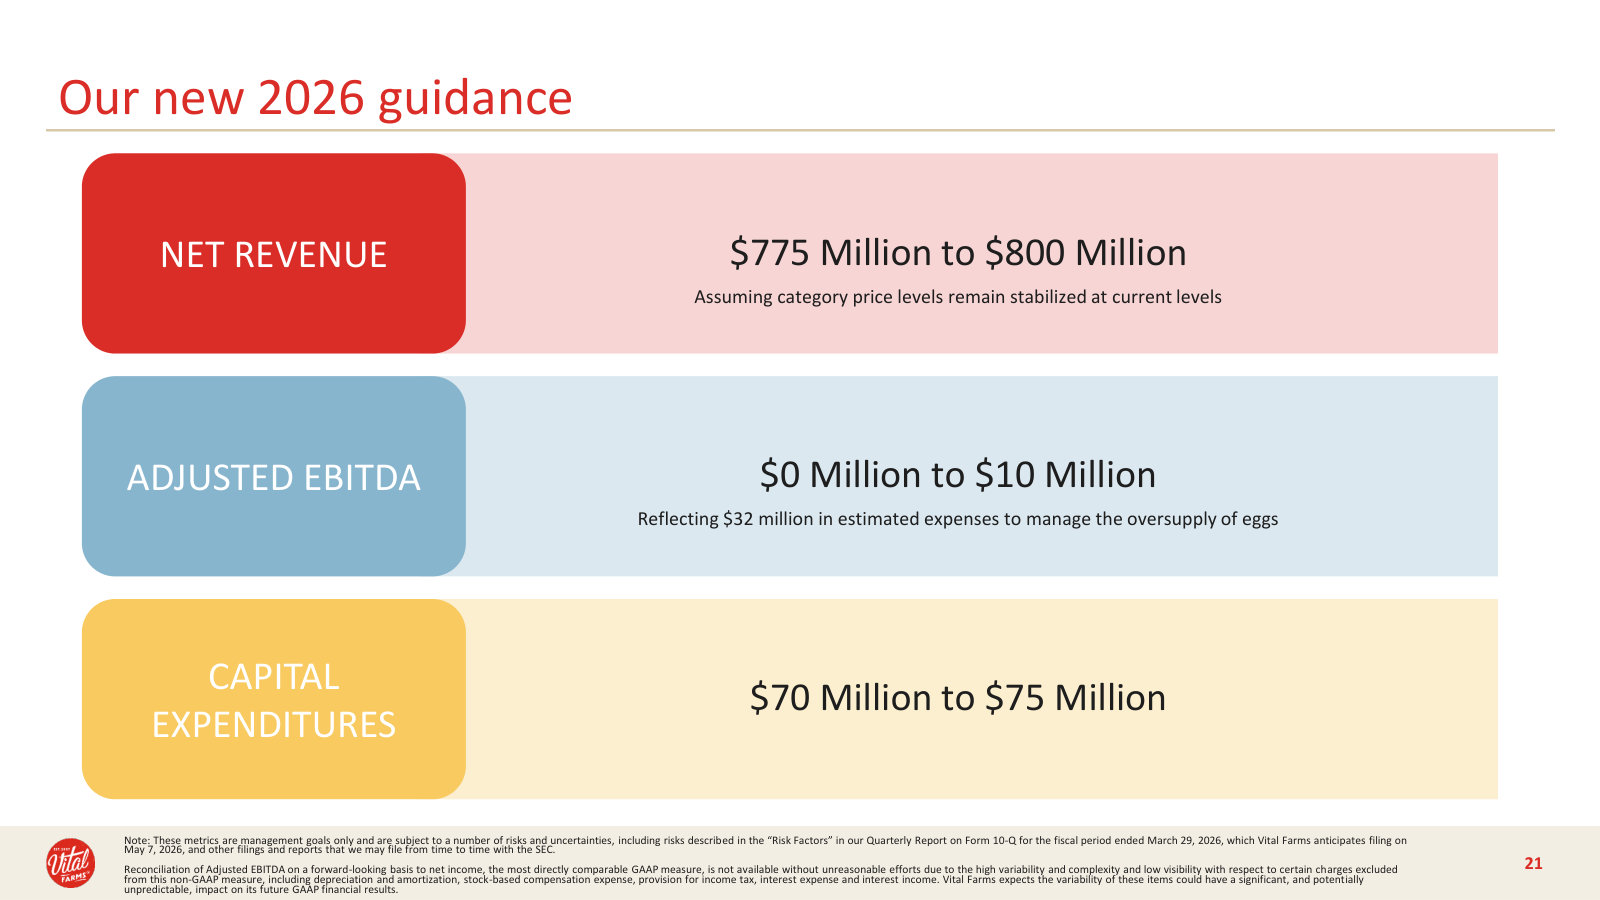
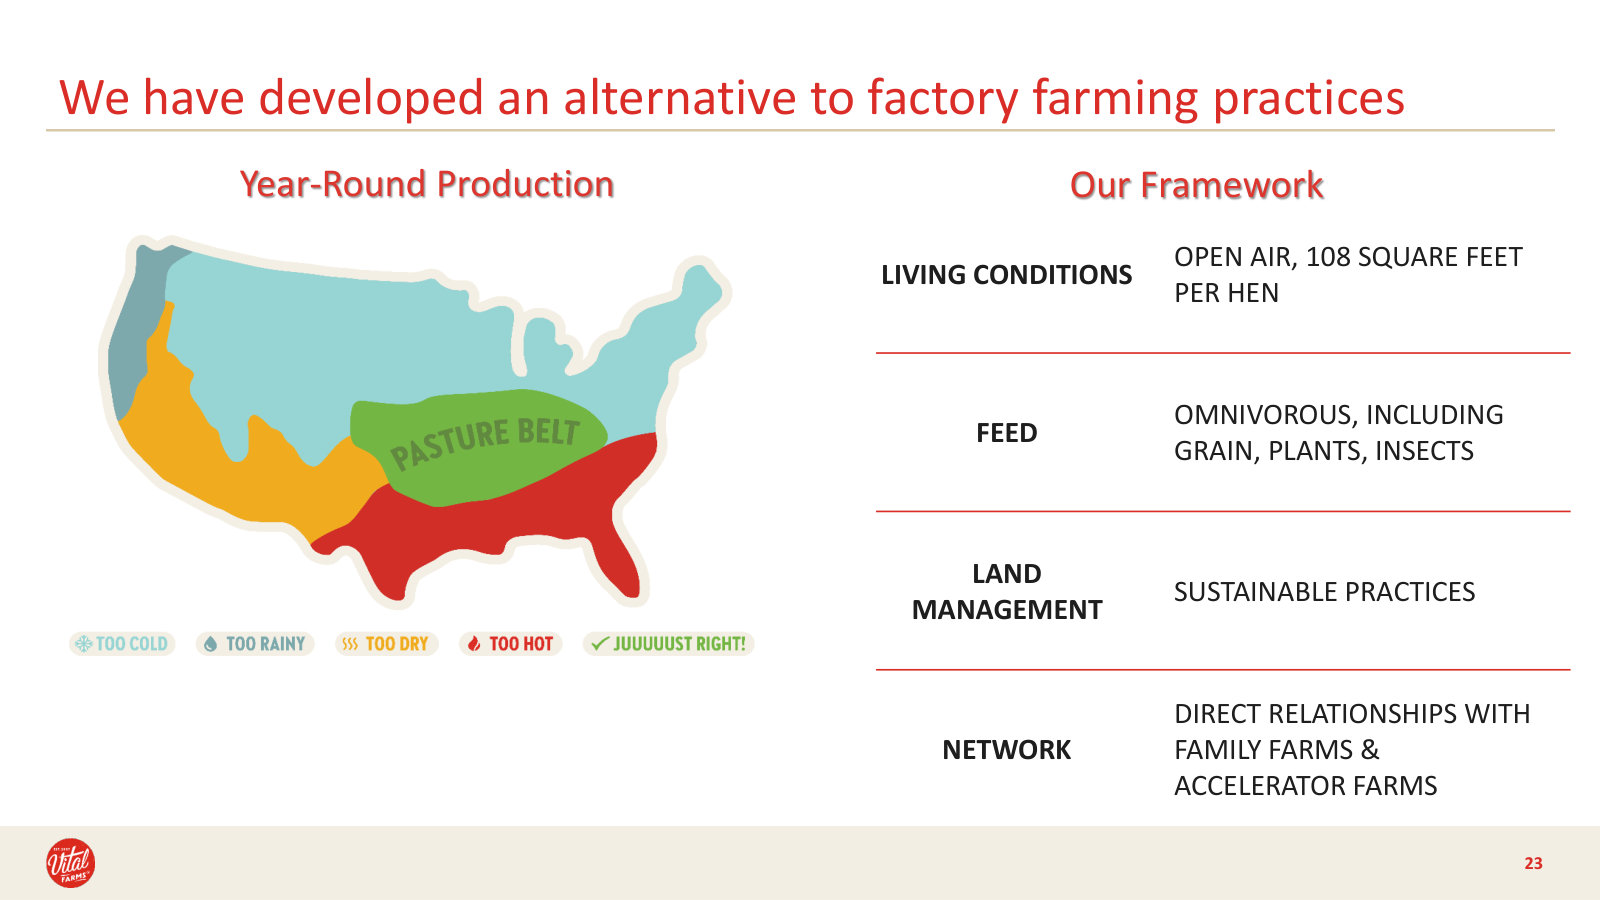
The current snapshot — how the 2026 egg-price reset hit margins, plus the latest operating metrics and cut full-year guidance. · Open the full document →
More from management
Q4 & Full-Year 2025 Results — Q4/FY 2025 · 22 pages · The full-year 2025 scorecard and the jumping-off point into 2026, two months before the egg-price reset showed up. · Open →
Q1 2025 Investor Presentation — Q1 2025 · 18 pages · Where the earlier 2027 targets were laid out — the plan the 2025 investor day later replaced with 2030 goals. · Open →
Q4 & Full-Year 2024 Results — Q4/FY 2024 · 23 pages · The full-year 2024 results deck — the prior annual baseline before the investor-day reset. · Open →
Vital Farms, Inc.'s management answers for the business every quarter. These are the exchanges that explain it best — verbatim, from the call transcripts preserved in Sources. Each link opens the full transcript at that page in a new tab.
First Quarter 2026 Earnings Call — Q1 FY2026
The thesis stress-test: management resets 2026 guidance after price gaps to premium rivals widened, and lays out how the eggs-first model absorbs an oversupply shock. · Open the full transcript →
Loyalty held, but new-household trial fell as price gaps widened — the core of the reset.
Russell Diez-Canseco (Executive Chairperson, President & CEO): It's important to note that despite these price gaps, our existing base of consumers have remained loyal. However, the rate at which new households are trying us for the first time dropped significantly. In 2024 and 2025, more than 55% of our consumers were households that had not bought us previously. That dropped to just 50% in the first quarter of 2026. This demonstrates our reduced ability to convert growing brand awareness into trial at these price gap levels. In contrast, our consumer data also shows that our existing consumers continue to be loyal and have generally resisted trading down to lower priced alternatives. Buy rates are holding up very well with units per retained household 2% higher in the first quarter than the average for the prior 8 quarters.
p. 2 · Read in context →
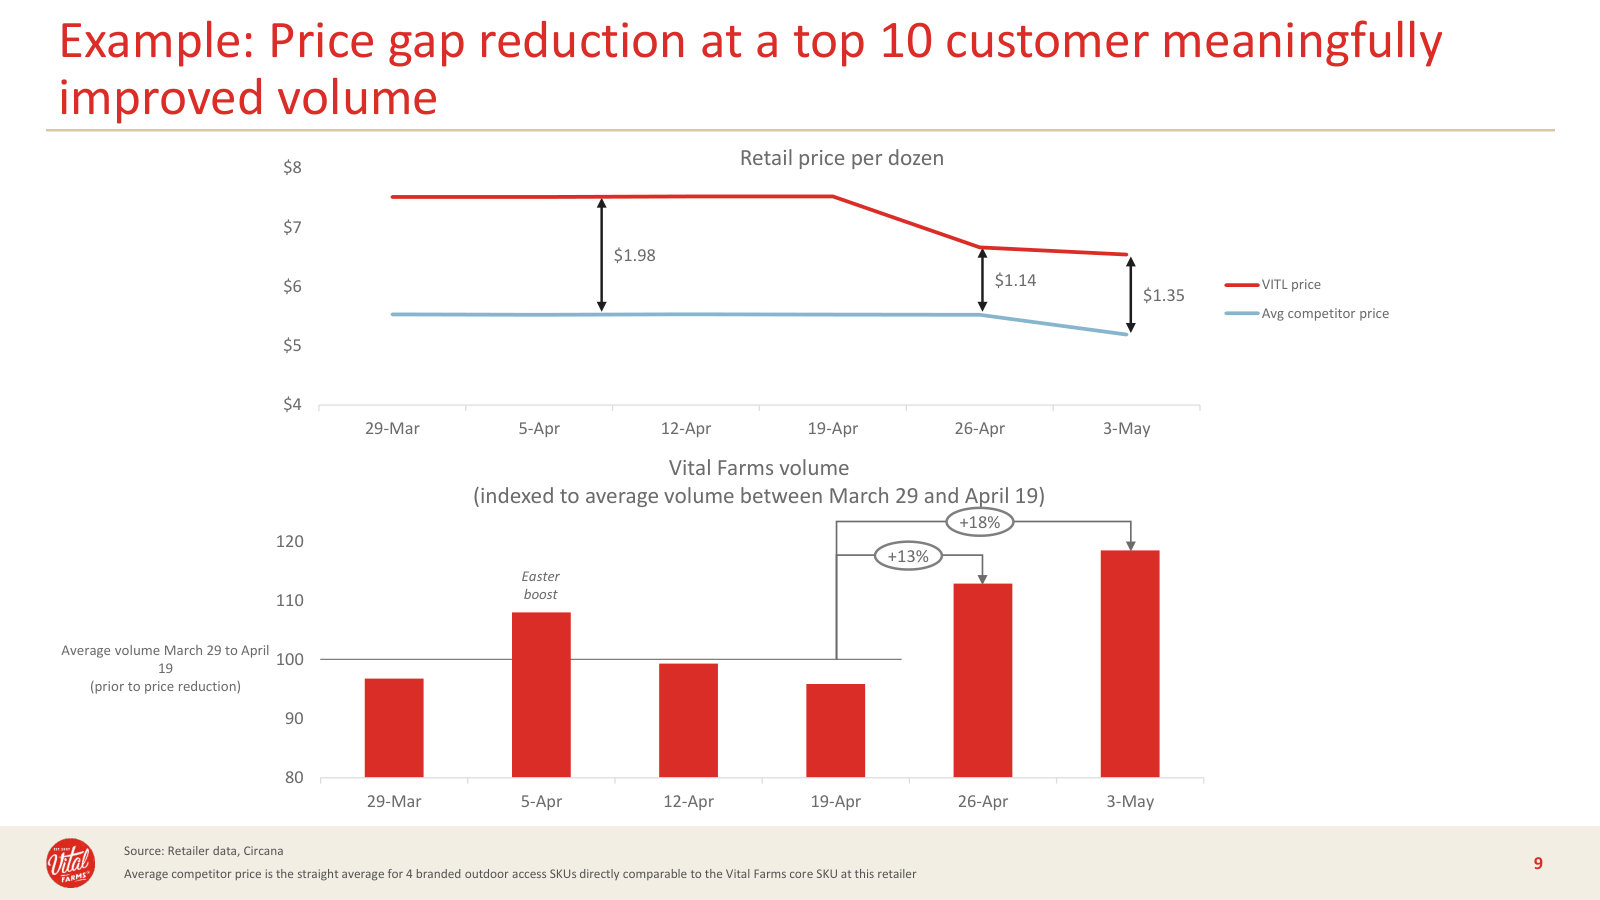
The fix, quantified: cutting one top-10 customer's gap from 35% to 25% lifted volume 18% in two weeks.
Russell Diez-Canseco (Executive Chairperson, President & CEO): Our data shows that in geographies where price gaps to outdoor access competitors have widened the most, volume growth is negative. And where price gaps have remained more moderate, we continue to see healthy growth without needing to race to the bottom on promotions. That means we need to narrow these price gaps in the marketplace in a targeted way, geography by geography and retailer by retailer. That work is underway, and we believe initial efforts show positive results. For example, we recently addressed price gaps at a top 10 customer, bringing them from about 35% above a group of competing premium branded outdoor access eggs to about 25% and volumes increased by 18% after just 2 weeks compared to the prior 4 weeks.
p. 2 · Read in context →
Why buying every farmer's eggs creates a costly overhang — and how contract amendments unwind it.
Russell Diez-Canseco (Executive Chairperson, President & CEO): A big impact on our short-term margins is the cost of oversupply relative to our current rate of retail sales. Because we buy eggs from our farmer partners regardless of the retail sales environment, temporary imbalances between supply and demand can create a costly supply overhang. In the short run, this results in expanded inventories and then increased low revenue sales to the breaker channel. Since we expect the supply-demand mismatch to persist over the coming months, we're working with some of our farmer partners to manage supply through voluntary amendments to their contracts to cease production from existing blocks or delay placement of future blocks. In return, we make payments to the farmers to compensate them for the foregone profits, but that still represents meaningful savings versus the full cost of buying eggs we don't need.
p. 2 · Read in context →
Exiting butter to free $25M of cash and ~150–200 bps of gross margin, refocusing capital on eggs.
Russell Diez-Canseco (Executive Chairperson, President & CEO): Fifth, we are exiting butter. We have made the decision to exit our butter business, ending shipments toward the end of the year. We expect that this will free up $25 million in cash this year, reduce sales by an estimated $14 million in 2026 and improve gross margin by 150 to 200 basis points starting in 2027. This was not an easy decision, but we believe it's the right one, both for its near-term impact on our economics and because it refocuses human and financial capital to pursue more productive growth opportunities.
p. 2 · Read in context →
The hard question — is the margin target still real if this is the new normal? Not banking on price recovery.
Matthew Smith (Analyst, Stifel); Russell Diez-Canseco (Executive Chairperson, President & CEO): Russell, you called this reset, a reset of the year, not the ambition. The industry is recovering from a multiyear impact of avian influenza. And as you look at the competitive dynamic today, is this the new normal? And if that's so, is the long-term margin target, is that still relevant for Vital today? You talked about exiting this year at near 35% gross margin and double-digit EBITDA, but there's still some action in the background that could be a longer-term drag on the margin structure from pausing farmer contracts and incurring higher costs down the road. I guess what's the confidence in getting back to that double-digit EBITDA margin even if today's environment becomes the new normal? […] As we said in the prepared remarks, we are not assuming or waiting for a pricing recovery in the broader market to support our recovery in gross and EBITDA margins as we head into 2027. We are focused on making sure that we deliver the right economics even at these distressed prices in the market, although historically, they have not been enduring.
p. 6 · Read in context →
The category thesis, tested: the UK runs >75% outdoor-access; US adoption is accelerating even in a glut.
Glenn West (Analyst, William Blair); Russell Diez-Canseco (Executive Chairperson, President & CEO): This is Glenn West on for Jon Andersen this morning. Russell, you kind of noted some category metrics just on the outdoor access category. It's grown to 50% volume share, I think you said, and up 32% year-over-year. I guess I just wanted to ask: maybe you could help lay out the category. Is it like private label that's driving a lot of those share gains, or more competition from new insurgent smaller players? Or how is Vital sitting there in terms of share as well? […] I'd start by saying that we have seen for more than a decade that countries like the U.K. that are much further ahead in general awareness of food choices and food production systems are well above a majority of eggs being produced from outdoor access flocks. I believe the U.K. is well over 75%, in fact. And so one of the questions we've gotten over the years is, well, how high is that for the U.S. And I think part of what underlies that question is what's the willingness of consumers broadly across the economy to pay up for a better egg in their estimation. And we're seeing growth both in branded and private label. But most importantly, I think against an increasingly challenged macro backdrop, we're actually seeing an acceleration of adoption of outdoor access eggs on a volume share basis. And that shows up in the accompanying exhibits. And so from that perspective, I think the thesis that there's a real opportunity, an enduring opportunity in premium outdoor access eggs is as strong as it ever was. And we're seeing room for brands and for private label and for us in that group.
p. 9 · Read in context →
Fourth Quarter & Full Year 2025 Earnings Call — Q4 FY2025
The victory lap and the handoff — a record year over $100M EBITDA, the founder's retirement, and the $2B/2030 targets — right before the 2026 reset. · Open the full transcript →
Founder Matt O'Hayer retires after nearly 20 years; Russell adds executive chair to the CEO role.
Russell Diez-Canseco (Executive Chairperson & CEO): After nearly 20 years of visionary leadership, our founder, Matt O'Hayer, has decided to retire as executive chairperson and as a member of our board of directors. Matt founded Vital Farms, Inc. in 2007 with just 20 hens. […] Effective February 24th, the board appointed me to serve as Executive Chairperson and CEO. This unified leadership structure is the most effective way to maintain our strong momentum, drive our 2026 strategic initiatives, and continue progressing toward the targets we set at the Investor Day in December.
p. 1 · Read in context →
The supply moat: a 600-farm pasture-raised network, up roughly 175 farms in a single year.
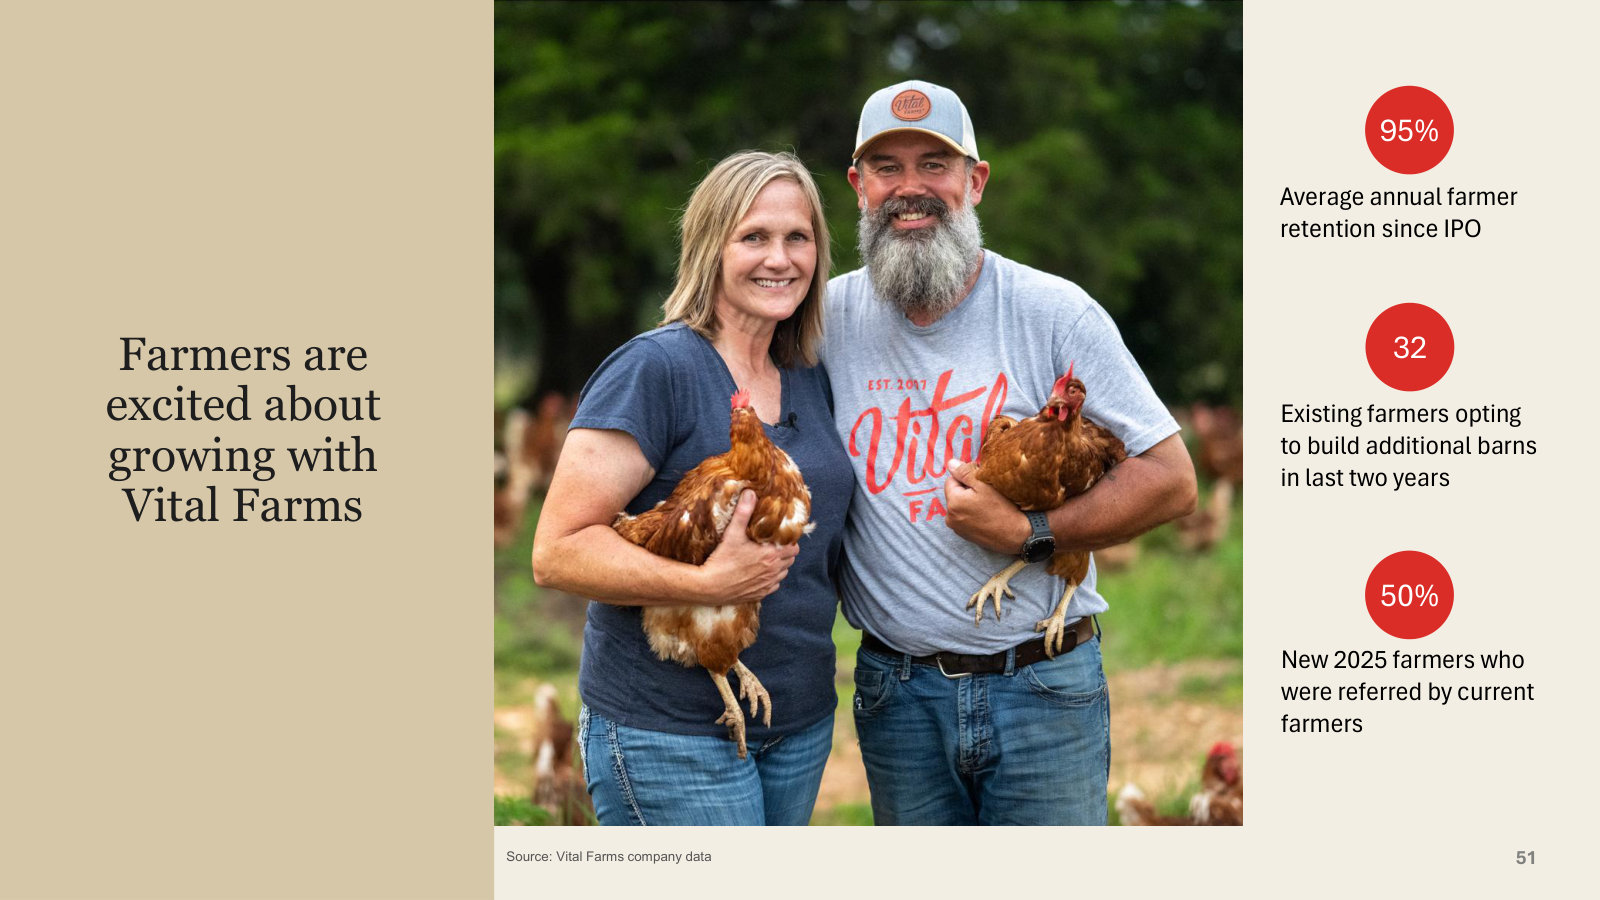
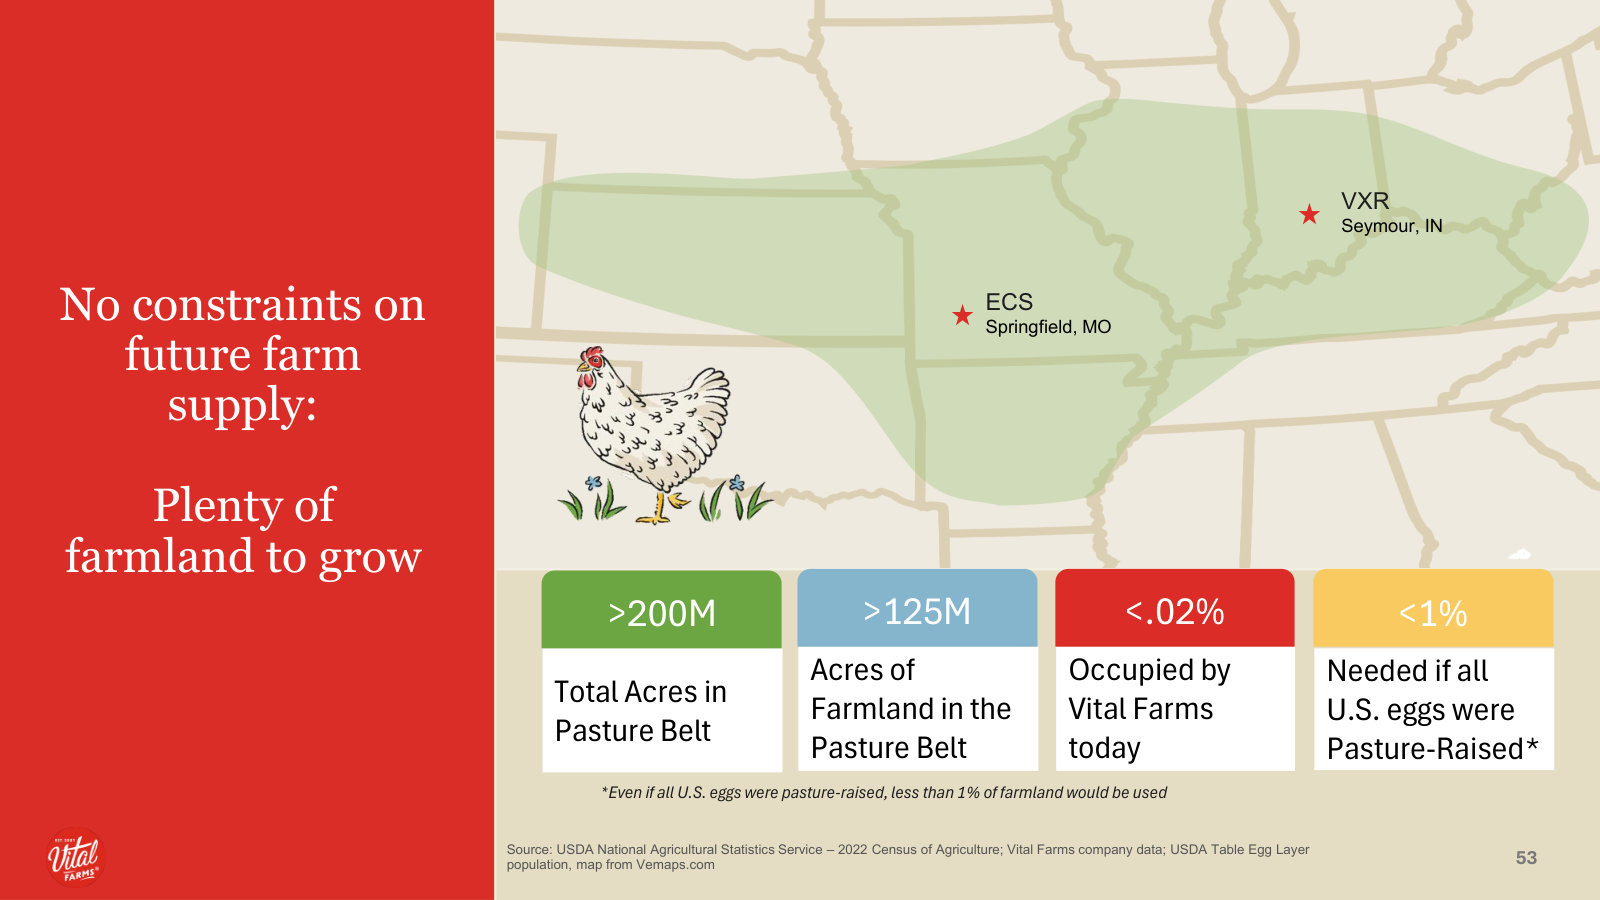
Russell Diez-Canseco (Executive Chairperson & CEO): our farm network expanded to more than 600 small farms committed to our pasture-raised standards, where hens roam freely on open pastures with year-round outdoor access. Adding approximately 175 farms in a single year is a testament to the trust we've built in the agricultural community around our unwavering commitment to humane animal care. Farmers want to be a part of what we're building because we offer a path to a sustainable livelihood while being stewards of the land and champions of animal welfare.
p. 2 · Read in context →
The reaffirmed frame: $2B revenue by 2030 at 15–17% EBITDA margin, with 16M households as runway.
Russell Diez-Canseco (Executive Chairperson & CEO): At our Investor Day in December, we shared our updated long-term target of $2 billion in net revenue by 2030, with Adjusted EBITDA margin between 15% and 17%. These goals are grounded in the operational capabilities we're building and the market opportunity we see ahead of us. Our brand still represents only a fraction of the total shell egg market, giving us substantial runway for growth. We serve nearly 16 million households through approximately 24,000 retail locations, but there's so much more opportunity ahead.
p. 2 · Read in context →
Pressed on whether the ~20% CAGR to 2030 leaves room for any slowdown; the sources-of-confidence answer.
Brian Holland (Analyst, D.A. Davidson); Russell Diez-Canseco (Executive Chairperson & CEO): kind of playing this forward, outlook this year, I think is, you know, low 20% range on the top line. That's an algorithm that you would have to hold from here through 2030, I think, to hit that $2 billion of revenue, if I'm not mistaken. The thought coming into this year was, you know, you'd be lapping capacity constraints in 1Q and a little less so in 2Q. 4Q, you would then have the ERP disruption. You know, quote-unquote, 'easier compares.' Now, we've obviously introduced some volatility, as you referenced, whether that's weather or some other things in the category. How do we think about the level of confidence, the sources of confidence behind maintaining this level of growth, which really demands almost no deceleration from here through 2030? What are the sources of confidence behind that? […] Again, the consumer value proposition is still very much there. You know, I start with all the work we did last year to make sure that we took supply chain constraint off the table in terms of being a constraint to our continued growth. We've got the capacity at ECS. We've got our third line, which gives us the opportunity to lean in both to capacity expansion and efficiency because we can allocate space to the various lines more efficiently. We're gaining volume share, and that's the thing I would point to as a continued proof point that what we're doing is working. As we head into 2026, the setup is we've got a massive gain in awareness, which is the leading indicator for us of trial and ultimately to loyalty. That's there in spades. We're very judiciously, as always, using our marketing and commercial resources to convert that awareness into trial. The capacity's there, the brand awareness is there, the consumer sentiment is there, and it's a question of, I think, operating and executing at a very high level. The thing is, we're built for this environment. We are, I believe we've got the best team in the business, the best brand in the business, the best supply chain in the business, and this is a year in which our ability to execute at a high level will continue to drive our growth.
p. 6 · Read in context →
First buyback since the IPO — deploying dry powder as a sign the company is maturing.
Thilo Wrede (CFO): This is the first buyback program that the board has authorized since the IPO. I would say there are two factors at play here. One is, look, we're listening to shareholders. We're listening to the buy side, the sell side. We've gotten a lot of questions over the last 12 months in particular about how we use our balance sheet. We have this unused debt capacity. As you know, we are debt-free. We have over $100 million in cash. We are investing this cash in building out the Seymour facility this year. That still leaves a lot of balance sheet potential there that we've been holding as dry powder. Now is a good time for us to think about what can we do with that dry powder to create shareholder value. That is where this decision to create the share repurchase authorization, so that when there is an opportunity in the market to buy back our stock at attractive levels, that we're able to step into that. That is really the reason behind it. It's I would look at it as a sign that we're maturing as a company a bit. We're doing the things that we think are the right things for creating long term shareholder value. It's a sign that, you know, we're listening to the shareholder conversations that we're having.
p. 10 · Read in context →
Fourth Quarter & Full Year 2023 Earnings Call — Q4 FY2023
The clearest ground-up explanation of the model: the family-farm network, Egg Central Station, and the path to $1 billion by 2027. · Open the full transcript →
How it makes money: 300+ family farms plus Egg Central Station, resilient through avian influenza.
Russell Diez-Canseco (President & CEO): Our resilient supply chain, with over 300 family farms and our world-class washing and packing facility at Egg Central Station, are big reasons why we are able to continually meet growing customer demand. Our supply chain model and our ability to execute has also enabled us to successfully navigate potential disruptions like avian influenza without significantly impacting our commitments to customers and consumers. We believe our strong close to 2023 sets us up for another important year on our progress to being a $1 billion company by 2027.
p. 4 · Read in context →
Farmer unit economics: absorbing barn-construction and interest costs so growers keep winning.
Adam Samuelson (Analyst, Goldman Sachs); Russell Diez-Canseco (President & CEO): Can you just elaborate a little bit on how the contract rates may have stepped up and what the implications of that are for cash and rent margins? […] As you know, we’ve always considered a steady pipeline of the right farmers to be critical to our long-term growth strategy and that hasn’t changed. We continue to enjoy strong relationships with excellent farmers and to continue to attract the right number of prospects as we continue to grow. But the reality is that if we look at the experience of our farmers over the last few years, they haven’t been immune to the inflationary forces that have affected so many other parts of the supply chain. The one piece that we’ve observed having more of a lingering effect is related to construction costs.
So, we continue to see elevated construction costs for new barn builds for new farmers, in part driven by cost of construction and in part driven by continued elevated interest rates on the loan that they take to do that construction.
p. 12 · Read in context →
Butter's ceiling foreshadowed: hard to find farms meeting standards — the seed of the 2026 exit.
Russell Diez-Canseco (President & CEO): started that butter business years ago with aspirations to grow it to $20 million at the time, that was about the size of the egg business. As we have expanded that butter business beyond $20 million, what we found is that it is increasingly hard to find the right farms that meet our very high standards. And so that has affected our ability to grow that business. The demand is there, but we’re unwilling to procure butter and work with co-packers that we don’t love.
p. 14 · Read in context →
More calls
Third Quarter 2025 Earnings Call — Q3 FY2025 · 10 pages · The last quarterly call before the December 2025 Investor Day that set the $2 billion-by-2030 target — management's read on the shift from supply-constrained to unconstrained capacity. · Open →
Second Quarter 2025 Earnings Call — Q2 FY2025 · 12 pages · Mid-2025, with commodity eggs still dear after avian influenza — the mirror image of the 2026 glut, and how management defended premium positioning over chasing volume. · Open →
First Quarter 2025 Earnings Call — Q1 FY2025 · 12 pages · The prior-year quarter (16.9% adjusted EBITDA margin) that the 2026 reset is measured against — the cycle's high-water mark for margins. · Open →
Fourth Quarter & Full Year 2024 Earnings Call — Q4 FY2024 · 11 pages · The 2024 wrap-up and 2025 setup — bringing a third ECS production line and a new ERP system online, and the pivot toward unconstrained supply. · Open →
First Quarter 2024 Earnings Call — Q1 FY2024 · 11 pages · An early execution call on the $1 billion-by-2027 plan — distribution and SKU-expansion mechanics, with Chief Sales Officer Peter Pappas on the line. · Open →
Fourth Quarter & Full Year 2021 Earnings Call — Q4 FY2021 · 34 pages · The first full-year call as a public company — the family-farm network, Egg Central Station's expansion toward $600M of capacity, and the premium-pricing rationale from the ground up. · Open →
Vital Farms, Inc.'s annual reports contain management's most considered account of the business. These are the sections, passages and visual pages worth opening in the originals preserved in Sources.
Vital Farms, Inc. — FY2025 Annual Report (Form 10-K) — FY2025 (fiscal year ended December 28, 2025)
The latest 10-K — the pasture-raised 600-family-farm model, a 25% revenue jump to $759M, and a just-remediated revenue material weakness. · Open the full document →
Item 1. Business — Our Company — p. 7 · Read the full section →
The founding story and the distributed family-farm supply chain that is the whole thesis, in management's own framing.
Industry Overview — p. 11 · Read the full section →
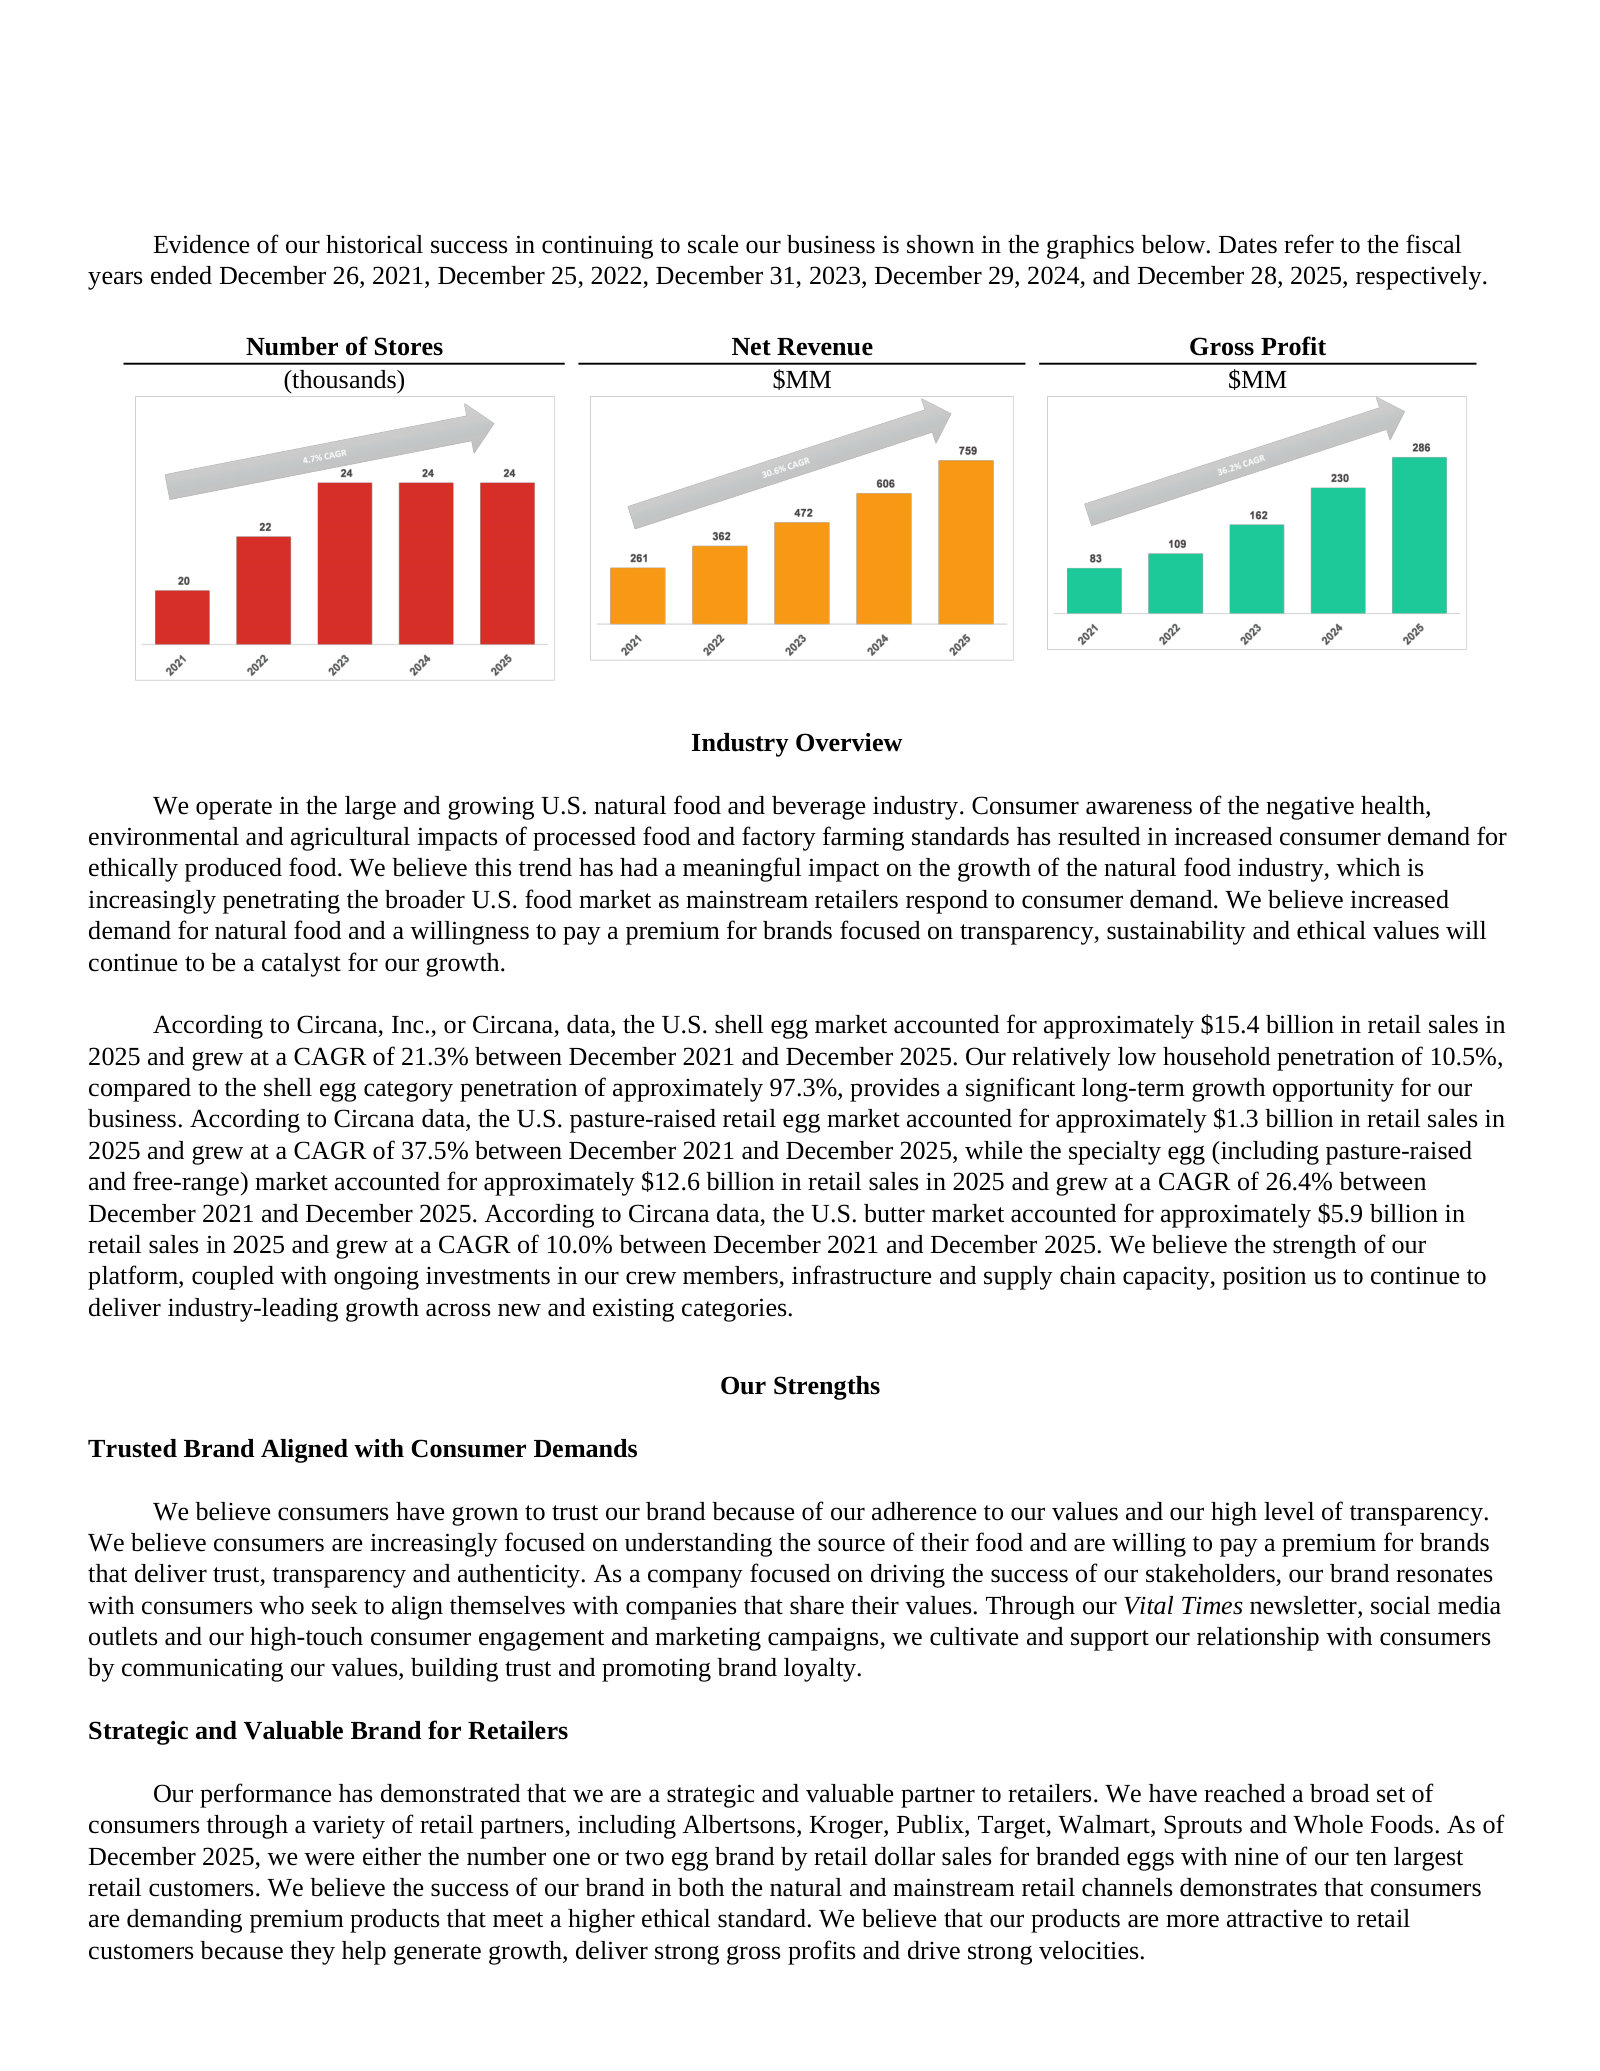
Sizes the runway: 10.5% household penetration against a ~97% category, next to the multi-year store/revenue/gross-profit ramp.
Household penetration of 10.5% versus ~97% for shell eggs overall — the headroom management points to.
Our relatively low household penetration of 10.5%, compared to the shell egg category penetration of approximately 97.3%, provides a significant long-term growth opportunity for our business.
p. 11 · Read in context →
Our Customers — p. 18 · Read the full section →
How the eggs actually reach shelves: 24,000+ stores split across the natural, mainstream and foodservice channels.
Channel mix — natural ~38% and mainstream ~62% of retail dollar sales across 24,000+ stores.
We market our products throughout the United States, with the majority of our net revenue coming from sales of our shell egg products. As of December 2025, we distribute through third parties and direct to retailers to reach more than 24,000 stores. […] Natural channel retailers, including Whole Foods and Sprouts, represented approximately 39%, 40% and 38% of our retail dollar sales in fiscal years 2023, 2024 and 2025, respectively. […] The mainstream channel represented approximately 61%, 60% and 62% of our retail dollar sales in fiscal years 2023, 2024 and 2025, respectively.
p. 18 · Read in context →
Supply Chain — p. 20 · Read the full section →
The physical backbone: a single Egg Central Station facility, the second plant now under construction, and Irish cream for butter.
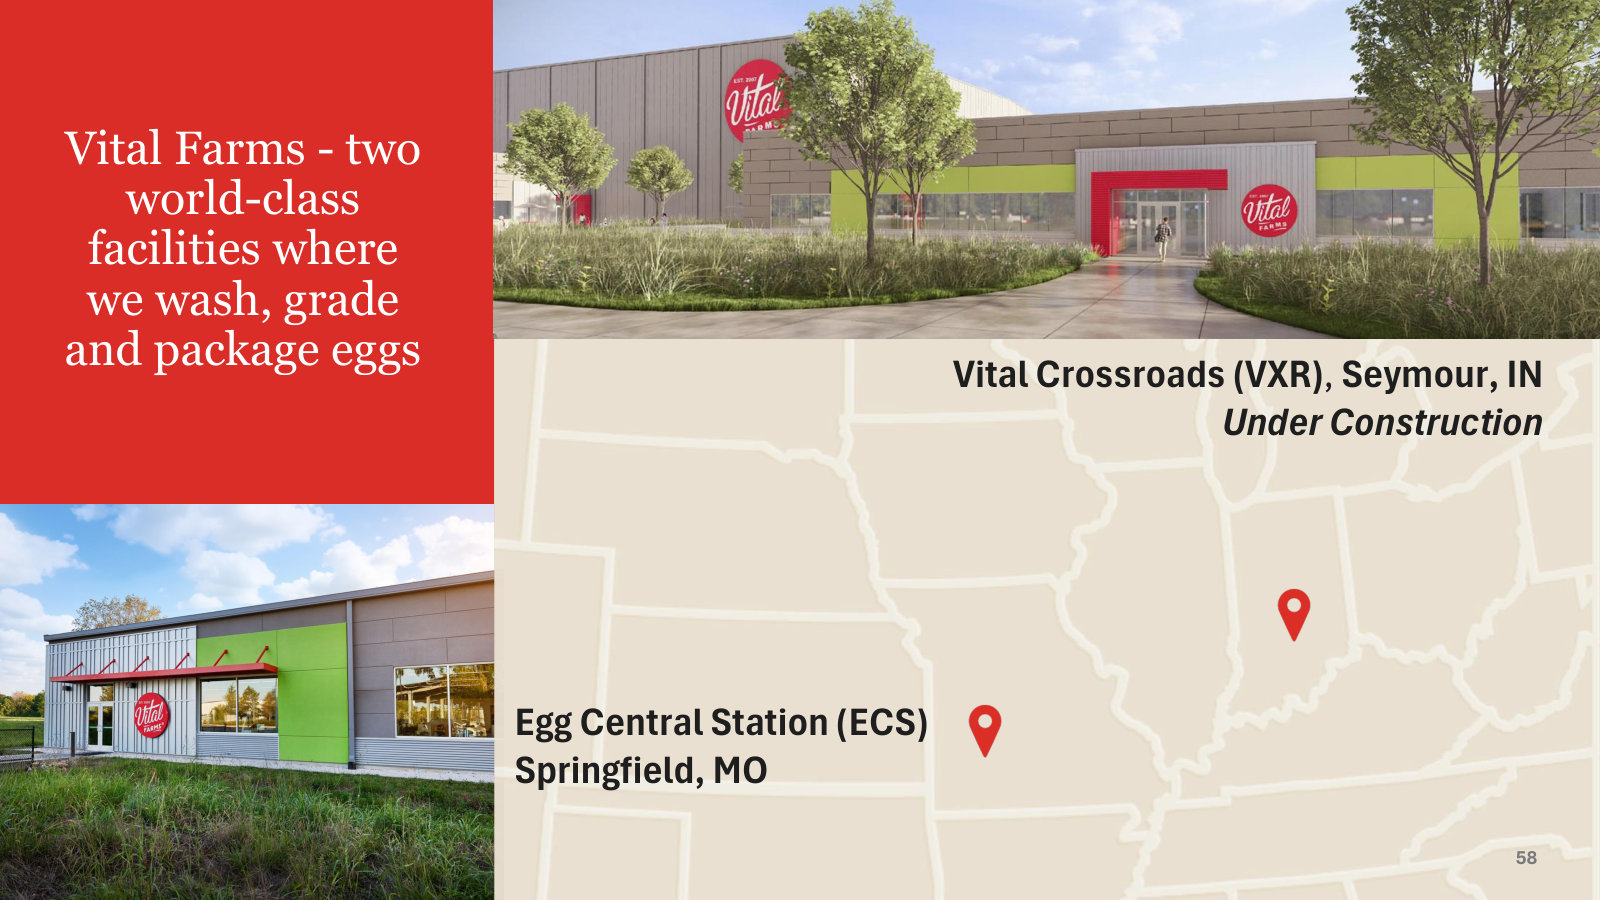
One processing hub today (Egg Central Station), a second (Vital Crossroads) targeted for 2027, and Ireland-sourced butter cream.
To capitalize on this strong supply network, we own and operate a state-of-the-art shell egg processing facility, Egg Central Station in Springfield, Missouri. […] To support continued supply and further growth, we broke ground in 2025 on Vital Crossroads, our planned second world-class egg washing and packing facility with onsite cold storage in Seymour, Indiana, which we anticipate will be fully operational in 2027. […] The cream for our butter is sourced primarily from dairy farms in Ireland.
p. 20 · Read in context →
Item 1A. Risk Factors — p. 31 · Read the full section →
The two risks most specific to this business: bird-flu/egg-disease outbreaks on its own farms, and ~93% revenue concentration in shell eggs.
Agricultural disease is live, not hypothetical: an HPAI outbreak in 2024 and EDS on 9 then 12 farms in 2024–2025.
Our business activities are subject to a variety of agricultural risks, including pests and diseases such as HPAI and egg drop syndrome, or EDS, the occurrence of which can materially and adversely affect the quality and quantity of products, including shell eggs, that we distribute. […] In fiscal 2024, we experienced an outbreak of HPAI at one of our farms. […] A total of nine of our farms experienced outbreaks of EDS in fiscal 2024 and 12 of our farms experienced outbreaks of EDS in fiscal 2025.
p. 43 · Read in context →
Single-product concentration: shell eggs are ~93% of net revenue.
Shell eggs accounted for approximately 95% of our net revenue in fiscal 2023, 93% of our net revenue in fiscal 2024 and 93% of our net revenue in fiscal 2025. Shell eggs are our flagship product and have been the focal point of our sales and marketing efforts.
p. 35 · Read in context →
Item 7. MD&A — Overview and Results of Operations — p. 98 · Read the full section →
Management's own read on FY2025: what the revenue growth was and how much came from volume versus price/mix.
FY2025 headline: revenue $759.4M, net income $66.3M, Adjusted EBITDA $114.0M.
We have experienced consistent sales growth. We had net revenue of $759.4 million and $606.3 million, net income of $66.3 million and $53.4 million, and Adjusted EBITDA of $114.0 million and $86.7 million in the fiscal years ended December 28, 2025 and December 29, 2024, respectively.
p. 100 · Read in context →
The +25% growth split roughly evenly: $78.3M volume, $74.9M price/mix.
The increase in net revenue of $153.1 million, or 25%, was driven by volume-related increases of $78.3 million and price/mix benefits of $74.9 million. Volume growth was driven by accelerated demand for existing products and expanded item offerings with existing customers.
p. 107 · Read in context →
Item 9A. Controls — Remediation of the Previously Reported Material Weakness — p. 177 · Read the full section →
A prior-year material weakness in the revenue process — and management's statement that it was remediated by year-end 2025.
More annual reports
Vital Farms, Inc. — FY2024 Annual Report (Form 10-K) — FY2024 (fiscal year ended December 29, 2024) · 183 pages · The edition where the revenue-process material weakness was first disclosed, before its FY2025 remediation. · Open →
Vital Farms, Inc. — FY2023 Annual Report (Form 10-K) — FY2023 (fiscal year ended December 31, 2023) · 167 pages · Captures the step-up to $472M revenue and the mainstream-channel expansion earlier in the growth curve. · Open →
Vital Farms, Inc. — FY2022 Annual Report (Form 10-K) — FY2022 (fiscal year ended December 25, 2022) · 139 pages · The Egg Central Station expansion year and the first full year of HPAI as an industry backdrop. · Open →
Vital Farms, Inc. — FY2021 Annual Report (Form 10-K) — FY2021 (fiscal year ended December 26, 2021) · 110 pages · The earliest edition on the shelf ($261M revenue), a useful baseline for the pasture-raised model and B-Corp framing. · Open →
Competitors describe Vital Farms, Inc.'s market in their own filings and calls. These verified passages and visual pages show where their strategies meet, using source documents preserved in Sources.
Cal-Maine Foods, Inc. (CALM)
Vital Farms' most direct competitor and the reference point for the U.S. shell-egg market it sells into — Cal-Maine is the largest U.S. shell-egg producer. Critically it is not only a conventional-egg giant: it produces the same specialty categories that are Vital Farms' entire business (cage-free, organic, free-range and pasture-raised), sources part of that specialty supply from contracted family farms, and lays out the economics of the specialty-egg premium in its own 10-K.
Cal-Maine's own view of the shell-egg market it shares with Vital Farms: an “intensely competitive” business fought on price, service and product quality that remains “highly fragmented” — the ten largest producers held roughly 57% of U.S. table-egg layer hens at the end of calendar 2025, up from 54% a year earlier.
The production, processing, and distribution of shell eggs is an intensely competitive business, which has traditionally attracted large numbers of producers in the U.S. Shell egg competition is generally based on price, service and product quality. The shell egg production industry remains highly fragmented. According to Egg Industry Magazine , the ten largest producers owned approximately 57% and 54% of industry table egg layer hens at calendar year -end 2025 and 2024, respectively
p. 12 · Read in context →
Cal-Maine describes the specialty-egg segment that is Vital Farms' core: pasture-raised, organic and free-range eggs have no independently quoted wholesale price, are negotiated directly with customers, and have historically fetched higher prices because consumers will pay more for them — the premium-pricing dynamic Vital Farms depends on, stated by a rival.
There is no independently quoted wholesale market price for other specialty shell eggs such as nutritionally enhanced, organic, pasture -raise and free-range eggs. Specialty shell eggs are typically sold at prices and terms negotiated directly with customers […] Historically, prices for specialty shell eggs have generally been higher due to customer and consumer willingness to pay more for specialty eggs.
p. 8 · Read in context →
Cal-Maine's specialty supply model echoes Vital Farms' family-farm sourcing: 10% of fiscal-2026 production came from contract producers, the majority “with family-owned farms for organic, pasture-raised and free-range eggs” — though under Cal-Maine's terms it owns the flock, furnishes the feed and assumes the market risk.
In fiscal 2026, 90.0 % of our production came from Company -owned facilities, and 10.0% came from contract producers. The majority of our contract production is with family -owned farms for organic, pasture -raised and free-range eggs. Under a typical arrangement with a contract producer, we own the flock, furnish all feed and critical supplies, own the shell eggs produced and assume market risks.
p. 10 · Read in context →
Post Holdings, Inc. (POST)
Through its Foodservice (Michael Foods / Papetti's) and Refrigerated Retail egg businesses, Post Holdings is one of the largest U.S. producers of shell and value-added eggs — a direct competitor to Vital Farms in the egg case and in foodservice. Its filings size that egg exposure, show it investing to climb the same cage-free / animal-welfare ladder Vital Farms occupies, and describe a strategy of converting shell-egg demand into value-added eggs.
The scale and integration behind Post's egg franchise: thirteen U.S. egg-products plants, “some of which are fully integrated from the maintenance of laying flocks through the processing of egg products” — an industrial, vertically integrated model that contrasts with Vital Farms' asset-light network of family farms.
Our operations include thirteen egg products production facilities in the U.S., some of which are fully integrated from the maintenance of laying flocks through the processing of egg products, three potato processing facilities and two meat products processing and production facilities.
p. 9 · Read in context →
Post's stated view of the cage-free transition: restaurant, foodservice and grocery customers have set cage-free and other animal-welfare goals, and meeting that demand is driving added operating and capital costs to procure cage-free eggs and build new cage-free housing — a large conventional producer spending to move onto the welfare ground Vital Farms was built on.
Many restaurant chains, foodservice companies and grocery chains have announced goals to transition to a cage-free egg supply, as well as goals for other farm animal initiatives, by specified future dates. Also, several states have enacted, or may in the future enact, provisions providing for specific requirements for the housing of certain farm animals. Meeting anticipated customer demand has resulted, and will continue to result, in additional operating and capital costs to procure cage-free eggs, modify existing layer hen facilities and construct new cage-free layer hen housing and comply with other farm animal initiatives.
p. 23 · Read in context →
Post's CFO frames the demand collision plainly — “a nice runway when you think about converting folks from shell eggs over into value-added eggs” — casting the shell-egg category that is Vital Farms' primary business as a conversion opportunity for Post's processed-egg products.
Matt Mainer, Chief Financial Officer: And there's still a nice runway when you think about converting folks from shell eggs over into value-added eggs. So really the same dynamics we've seen for quite a few years. We're just back to a more normalized supply and demand dynamic.
p. 4 · Read in context →
The Hain Celestial Group, Inc. (HAIN)
Hain Celestial sells no eggs or dairy, but it is the scaled incumbent of the “better-for-you” natural-and-organic shelf that Vital Farms competes on. It claims the same purpose-driven, health-and-wellness positioning Vital Farms uses to justify a premium, fights for the same finite natural-channel shelf space, and concedes that nimble organic / natural brands — Vital Farms' category — can out-innovate it.
Hain Celestial's self-description mirrors Vital Farms' own: a global “health and wellness company whose purpose is to inspire healthier living… through better-for-you brands,” sold in over 70 countries — an incumbent occupying the same purpose-driven, better-for-you positioning Vital Farms uses to justify its premium.
Hain Celestial is a leading global health and wellness company whose purpose is to inspire healthier living for people, communities and the planet through better-for-you brands. For more than 30 years, Hain Celestial has intentionally focused on delivering nutrition and well-being that positively impacts today and tomorrow.
p. 5 · Read in context →
From Hain's risk factors: it competes with “other organic and natural packaged food brands… which may be more innovative and able to bring new products to market faster and may be better able to quickly exploit and serve niche markets” — an incumbent conceding the very threat that fast-moving natural brands like Vital Farms pose.
We also compete with other organic and natural packaged food brands and companies, which may be more innovative and able to bring new products to market faster and may be better able to quickly exploit and serve niche markets.
p. 19 · Read in context →
Danone S.A. (BN)
Danone is a global dairy and health-food major whose brand thesis runs closely parallel to Vital Farms': “Health Through Food,” regenerative agriculture and animal welfare across its supply chain, and — as of late 2025 — global B Corp certification, the same ethical-brand credential Vital Farms holds. Hain's own 10-K lists Danone among its principal competitors; it collides with Vital Farms less on eggs than on premium, purpose-driven nutrition positioning, at far larger scale.
Danone's stated regenerative-agriculture and animal-welfare commitment — protecting “soil, water, biodiversity and animal welfare” and “supporting farmers,” with 42% of directly sourced key ingredients from farms transitioning to regenerative practices — a global-scale version of the farmer-network, animal-welfare story at the center of Vital Farms' brand.
Danone is committed to regenerative agriculture, promoting practices that protect soil, water, biodiversity and animal welfare, and supporting farmers in the shift toward more resilient and fair agricultural models. […] 42%
of key ingredients we source directly come from farms that have begun to transition to regenerative agriculture
p. 30 · Read in context →
Danone's “Health Through Food” thesis: better health starting with better nutrition, a portfolio “that combines taste, health, and sustainability” — the same health-and-purpose framing Vital Farms markets on, advanced by a rival many times its size.
We strongly believe that better health starts with better nutrition and behaviors. Danone’s ambition is anchored in a distinctive portfolio that combines taste, health, and sustainability. This is how we bring Health Through Food - by combining science and innovation. […] Danone has achieved all its Health Through Food targets set for 2025 and exceeded several of them.
p. 15 · Read in context →
In November 2025 Danone completed global B Corp certification covering 98% of employees and net sales — matching, at multinational scale, the Certified B Corporation credential that is a pillar of Vital Farms' ethical-brand identity.
In November 2025, Danone achieved its objective of completing global B Corp™ certification. In 2025, 98% of Danone employees and 98% of Danone global net sales are covered by B Corp certification […] This milestone marks the culmination of a 10-year certification process, underscoring Danone’s long-standing commitment to delivering business success while driving positive social and environmental impact.
p. 41 · Read in context →
More peer documents
Q2_FY2026 — 11 pages · Earnings-call discussion of specialty and cage-free egg demand, mix shift and egg-price normalization from the largest U.S. egg producer — management color on the segment dynamics that drive Vital Farms. · Open →
Q4_FY2025 — 8 pages · Management guides continued elevated Foodservice spending behind precooked and cage-free eggs into FY2026 — capex explicitly aimed at the value-added and welfare-egg space adjacent to Vital Farms. · Open →
Q1_FY2026 — 8 pages · Interim CEO argues Hain's better-for-you “credentials” justify a price premium even as shoppers seek value — a read on premium natural-brand pricing power directly relevant to Vital Farms' own pricing durability. · Open →
BN_annual_report_FY2024 — 496 pages · Page 316 (French-language universal registration document) discloses Danone audits animal welfare across its milk, meat, beef, egg and fish suppliers — the closest Danone comes to Vital Farms' own egg category and welfare-sourcing claims. · Open →
Source: S&P Capital IQ consensus via Xpressfeed · Generated 2026-07-26.
Vital Farms' consensus tape has been cut hard over the past six months: FY2027 revenue is down about 25% and normalized EPS about 80% versus 180 days ago, though the pace of cuts has slowed in the last month. A long run of large EPS beats broke with two consecutive misses in FY2025 Q4 and FY2026 Q1, and analysts now model a loss-making FY2026 margin trough before a partial FY2027-28 recovery. Coverage thins sharply beyond FY2027, and the street sits mostly at Hold.
Street slashed FY27 EPS ~65% and revenue ~17% over 90 days
The 30-day change is near flat for revenue, so most of the reduction landed one to six months ago rather than recently.
Currency: USD · Scale: money in millions, absolute · Point-in-time consensus; Δ90d is Now versus 90d.
| Metric | FY | 180d | 90d | 30d | Now | Δ90d |
|---|---|---|---|---|---|---|
| EPS (normalized) | FY2027 | $2.16 | $1.26 | $0.50 | $0.44 | -64.6% |
| EPS (normalized) | FY2028 | — | $1.07 | $0.49 | $0.49 | -54.2% |
| Revenue | FY2027 | $1.14bn | $1.02bn | $846.92m | $848.58m | -16.8% |
| Revenue | FY2028 | — | $1.17bn | $905.33m | $946.40m | -18.8% |
Six straight EPS beats, then two consecutive misses
Revenue has stayed close to consensus throughout; the swing is concentrated in EPS, where FY2026 Q1 landed well below the estimate.
Current sequences by metric: Revenue: 4 consecutive beats; EPS (normalized): 2 consecutive misses.
Currency: USD · Scale: money in millions, absolute · Consensus is captured before each actual first became effective.
| Quarter | Metric | Consensus | Actual | Surprise | Outcome |
|---|---|---|---|---|---|
| Q1 FY2026 | Revenue | $182.37m | $187.16m | +2.6% | Beat |
| Q1 FY2026 | EPS (normalized) | $0.06 | -$0.03 | -150.8% | Miss |
| Q4 FY2025 | Revenue | $212.83m | $213.55m | +0.3% | Beat |
| Q4 FY2025 | EPS (normalized) | $0.39 | $0.35 | -11.2% | Miss |
| Q3 FY2025 | Revenue | $191.43m | $198.94m | +3.9% | Beat |
| Q3 FY2025 | EPS (normalized) | $0.30 | $0.36 | +20.0% | Beat |
| Q2 FY2025 | Revenue | $170.81m | $184.77m | +8.2% | Beat |
| Q2 FY2025 | EPS (normalized) | $0.27 | $0.36 | +31.7% | Beat |
| Q1 FY2025 | Revenue | $162.98m | $162.19m | -0.5% | Miss |
| Q1 FY2025 | EPS (normalized) | $0.26 | $0.37 | +43.0% | Beat |
| Q4 FY2024 | Revenue | $160.32m | $165.99m | +3.5% | Beat |
| Q4 FY2024 | EPS (normalized) | $0.17 | $0.23 | +39.4% | Beat |
| Q3 FY2024 | Revenue | $145.30m | $145.00m | -0.2% | Miss |
| Q3 FY2024 | EPS (normalized) | $0.12 | $0.16 | +33.3% | Beat |
| Q2 FY2024 | Revenue | $138.42m | $147.39m | +6.5% | Beat |
| Q2 FY2024 | EPS (normalized) | $0.20 | $0.36 | +81.8% | Beat |
Consensus models a FY26 loss-year margin trough, then recovery
Gross margin is modelled to fall from about 38% in FY2025 to about 26% in FY2026 before rebuilding toward roughly 33% by FY2028.
Currency: USD · Scale: money in millions, absolute · YoY uses the prior fiscal year from the feed; analyst count and range use the first displayed period.
| Metric | FY2025A | FY2026E | FY2027E | FY2028E | YoY | Analysts | Low / high |
|---|---|---|---|---|---|---|---|
| Revenue | $758.94m | $775.31m | $848.58m | $946.40m | — | 11 | $755.00m / $761.60m |
| Gross margin | 37.9% | 25.6% | 29.7% | 33.0% | — | — | — |
| EPS (normalized) | $1.48 | -$0.42 | $0.44 | $0.49 | — | 10 | $1.45 / $1.50 |
| EBITDA | $115.37m | $3.42m | $45.67m | $74.00m | — | 12 | $115.00m / $116.00m |
Wide FY27 dispersion: EPS $0.21-$0.90, EBITDA $10m-$65m
Coverage is deepest at FY2027, yet the ranges frame an unresolved debate over how far and how fast margins recover.
Currency: USD · Scale: money in millions, absolute · Spread/mean is absolute high-low divided by absolute mean.
| Metric | Period | Mean | Low–high | Spread/mean | Analysts |
|---|---|---|---|---|---|
| EPS (normalized) | FY2027E | $0.44 | $0.21–$0.90 | 155.3% | 7 |
| EBITDA | FY2027E | $45.67m | $10.06m–$64.90m | 120.1% | 9 |
| Revenue | FY2027E | $848.58m | $798.70m–$987.00m | 22.2% | 10 |
Mostly Hold - 7 of 10 neutral, no sells; targets $10-$16
Currency: USD · Scale: money in millions, absolute · Analyst counts shown explicitly.
| Street view | Reading | Analysts |
|---|---|---|
| Recommendation mix | Buy 2, Outperform 1, Hold 7, Underperform 0, Sell 0 | 10 |
| Consensus score | 2.50 | 10 |
| Target price | mean $12.00; median $12.00; high $16.00; low $10.00 | 8 |
FY2028 rests on just one or two analysts
FY2028 revenue, EPS and net income each rest on a single estimate, and EBITDA on two; treat the outer year as indicative, not consensus.
Visible Alpha broker models via S&P Xpressfeed · 10 brokers · 316 line items · freshest revision 2026-07-21.
Broker models frame Vital Farms as a 2026 profit air-pocket rather than a growth story. Revenue keeps climbing every year through 2028, but a cost spike craters FY2026 profitability — gross margin falls from the high-30s to the mid-20s and the models flip to an operating loss — before a partial, contested recovery. Consensus on the top line is tight; the real debate is how much margin comes back and whether the 2025 peak is gone for good.
Key drivers
Revenue rises every year, yet FY2026 cost of goods sold jumps well ahead of it, collapsing gross margin and pushing the models to an operating loss. The FY2027 rebound only partly repairs the damage.
| Line | FY-2025A | FY-2026E | FY-2027E | FY-2028E | YoY | Brokers |
|---|---|---|---|---|---|---|
| Top line | — | — | — | — | — | — |
| Net revenue | $759.24m | $776.19m | $835.32m | $954.52m | +2.2% | 10 |
| Margin | — | — | — | — | — | — |
| Cost of goods sold | $471.28m | $576.49m | $590.11m | $664.88m | +22.3% | 10 |
| Gross profit | $287.96m | $199.70m | $245.21m | $289.63m | -30.7% | 10 |
| Gross margin(%) | 37.9% | 25.7% | 29.4% | 30.3% | -12.2pt | 10 |
| Profit | — | — | — | — | — | — |
| EBITDA - Operating | $115.39m | $3.86m | $50.09m | $59.46m | -96.7% | 10 |
| EBITDA margin(%) | 15.2% | 0.5% | 6.0% | 6.2% | -14.7pt | 10 |
| Operating income/(loss) | $90.33m | $-24.63m | $19.25m | $22.29m | -127.3% | 10 |
| Net income/(loss) | $67.04m | $-19.19m | $12.17m | $22.04m | -128.6% | 10 |
| EPS-Diluted($) | $1.46 | $-0.43 | $0.27 | $0.49 | -129.7% | 9 |
How deep the 2027 rebound goes is genuinely contested
On FY2027 the models range from a lingering operating loss to a solid profit, and EBITDA spreads roughly threefold. The dispute is the value question here.
| Line | Period | Median | Q1–Q3 | Min–max | Brokers |
|---|---|---|---|---|---|
| Gross profit | FY-2027E | $247.21m | $237.86m–$254.78m | $213.65m–$273.14m | 8 |
| EBITDA - Operating | FY-2027E | $51.25m | $48.85m–$54.34m | $24.68m–$64.91m | 8 |
| Operating income/(loss) | FY-2027E | $20.81m | $16.71m–$24.51m | $-5.63m–$33.66m | 8 |
| EPS-Diluted($) | FY-2027E | $0.34 | $0.13–$0.36 | $-0.05–$0.62 | 7 |
Eggs carry the model; the butter & ghee bet stays small and choppy
Eggs are the near-entirety of revenue and set the trajectory. Butter & ghee is a minor line that the models dip in FY2026 before recovering — and it rests on only 3-5 brokers.
| Line | FY-2025A | FY-2026E | FY-2027E | FY-2028E | YoY | Brokers |
|---|---|---|---|---|---|---|
| Total | — | — | — | — | — | — |
| Net revenue | $759.24m | $776.19m | $835.32m | $954.52m | +2.2% | 10 |
| Product | — | — | — | — | — | — |
| Total revenue - Eggs | $732.61m | $787.90m | $874.61m | $1.02bn | +7.5% | 5 |
| Total revenue - Butter and ghee | $27.56m | $15.46m | $33.52m | $44.84m | -43.9% | 5 |
Models call it a lasting reset, not a blip
Revenue keeps climbing every year through FY2028, yet modeled EBITDA and margins never return to their 2025 peak — the street is treating the cost step-up as permanent, not a one-year dip.
Segment KPIs are single-broker; out-years thin
Sales volume (dozens) and average selling price per dozen carry just one broker and move erratically year to year, so treat them as a single view, not consensus. FY2028 thins to 2-3 brokers on most lines.
Headline P&L consensus, momentum and beat/miss live in the CapIQ tab.
Source: S&P Capital IQ transcripts via Xpressfeed · latest indexed call 2026-05-07 · generated 2026-07-26.
Latest call digest
Vital Farms, Inc., Q1 2026 Earnings Call, May 07, 2026 · 2026-05-07T12:30:00
Q1 2026 call (May 7, 2026). The prepared remarks were a guidance reset. Management cut FY2026 net-sales guidance to $775 million to $800 million and adjusted EBITDA to $0 million to $10 million, down from the $900 million to $920 million and $105 million to $115 million set three months earlier, citing price gaps that reached "levels that our brand could not sustain." First-quarter net revenue still grew 15.4% to $187.2 million, but gross margin fell to 28.3% from 38.5% a year earlier and adjusted EBITDA dropped to $5 million. Management laid out a five-part self-help plan: right-sizing farmer supply (via paid contract amendments plus low- or no-revenue breaker-channel sales), reducing COGS (about $4 million of ECS staffing), managing SG&A (eliminating roughly 10% of remote headcount), controlling CapEx (about $75 million lower, mainly by slowing the Vital Crossroads / Seymour build and pausing accelerator farms) and exiting the butter business. The Q&A was harder-edged than the "reset of our expectations, not a reset of our ambitions" framing. Analysts pressed on the cash bridge and covenants (a revolver draw is now planned), where Q2 EBITDA bottoms (negative, mid- to high-teens), the credibility of a 2027 return to double-digit EBITDA margins, and the wisdom of exiting butter and slow-rolling Seymour. Notably, the company still repurchased over 1 million shares for $20 million in the quarter and continued to tout distribution wins (TDPs ending Q1 at 149.8, targeting 170 to 175 by Q4).
Participant coverage from the latest call.
| Group | Participants | Count |
|---|---|---|
| Management | Operator; Brian Shipman — VP & Head of Investor Relations, Vital Farms, Inc.; Russell Diez-Canseco — President, CEO & Executive Chairperson, Vital Farms, Inc.; Thilo Wrede — CFO, Chief Accounting Officer & principal accounting officer, Vital Farms, Inc.; Brian S. Shipman | 5 |
| Analysts | Matthew Smith — Associate Analyst, Stifel, Nicolaus & Company, Incorporated, Research Division; Eric Des Lauriers — Senior Research Analyst, Craig-Hallum Capital Group LLC, Research Division; Brian Holland — MD & Senior Research Analyst, D.A. Davidson & Co., Research Division; Robert Moskow — Managing Director and Food & Beverages, TD Cowen, Research Division; Glenn West — Research Analyst, William Blair & Company L.L.C., Research Division; Benjamin Mayhew — VP & Associate, BMO Capital Markets Equity Research; Benjamin Klieve — Research Analyst, The Benchmark Company, LLC, Research Division; Scott Marks — Equity Analyst, Jefferies LLC, Research Division; John Baumgartner — Former MD & Senior Consumer Equity Research Analyst, Mizuho Securities USA LLC, Research Division; Megan Christine Alexander — VP & Equity Analyst, Morgan Stanley, Research Division | 10 |
Curated latest-call exchanges; one row per analyst topic.
| Analyst | Firm | Topic | What changed in Q&A |
|---|---|---|---|
| Matthew Smith | Stifel, Nicolaus & Company | Long-term margin credibility | Asked whether the double-digit EBITDA target still holds if today's distressed pricing becomes the new normal; management said it is not waiting on an industry price recovery to restore gross and EBITDA margins. |
| Eric Des Lauriers | Craig-Hallum Capital Group | Liquidity and covenants | Questioned the cash bridge given about $51 million of cash against planned CapEx; management confirmed it will start using the revolver, cited a 3.5x net-leverage and 1.35x fixed-charge covenant, and said talks with JPMorgan are ongoing. |
| Brian Holland | D.A. Davidson | Where EBITDA bottoms | Pushed for a tighter Q2 trough; the CFO pointed to negative EBITDA in the mid- to high-teens, with the majority of the $32 million of supply-management cost hitting Q2. |
| Robert Moskow | TD Cowen | Butter exit | Challenged the decision to exit butter and step back from shelf, asking about licensing alternatives; management framed it as refocusing capital and management on the higher-advantage egg business. |
| Benjamin Mayhew | BMO Capital Markets | Vital Crossroads pause | Asked how long construction can be slow-rolled while return economics still work; management said it can restart and finish in under a year and that ECS still supports roughly $1 billion of revenue. |
| Megan Christine Alexander | Morgan Stanley | Volume-recovery drivers | Probed how much of the second-half volume inflection comes from closing price gaps versus new distribution, and how long velocities take to normalize; management leaned on distribution gains activated by recovering velocities. |
| John Baumgartner | Mizuho Securities | Buy rate vs. new-household trial | Asked where the pressure sits; management said existing consumers' buy rates are holding and even up slightly, and the shortfall is in first-time household trial. |
Theme tracker
Themes are curator-classified across supplied calls.
| Theme | Status | Quarters mentioned | Read-through |
|---|---|---|---|
| Price gaps to premium competitors | persisted | Q2 2024, Q3 2024, Q2 2025, Q3 2025, Q4 2025, Q1 2026 | Discussed nearly every quarter, but the message inverted. Management dismissed price gaps as having very limited impact through late 2025, then in Q1 2026 identified widening gaps as the direct cause of slowing trial and the guidance cut. |
| Egg supply constraints | dropped | Q2 2024, Q3 2024, Q4 2024, Q1 2025, Q2 2025 | The dominant limiter for a year-plus was not having enough eggs to meet demand. That framing disappeared by Q1 2026 as the problem inverted to oversupply. |
| Managing oversupply | emerged | Q1 2026 | New in Q1 2026: excess volume dumped to the breaker/low- or no-revenue channels and paid farmer contract amendments to cease or delay production, an estimated $32 million cost for the year. |
| Brand awareness converting to trial | persisted | Q4 2024, Q1 2025, Q2 2025, Q3 2025, Q4 2025, Q1 2026 | Aided awareness climbed from 26% to 34% over 2025, and the 'convert awareness to trial' refrain recurred throughout. By Q1 2026 the conversion faltered: new-to-brand households fell from over 55% to 50%. |
| Capacity investment (Seymour/VXR, ECS third line, accelerator farms) | persisted | Q2 2024, Q3 2024, Q4 2024, Q1 2025, Q2 2025, Q3 2025, Q4 2025, Q1 2026 | Aggressive build-out (two Seymour lines concurrently, CapEx pulled forward, third ECS line) through Q4 2025, then a sharp reversal in Q1 2026: Seymour slowed, accelerator farms paused, CapEx cut by about $75 million. |
| Tariffs | dropped | Q1 2025, Q2 2025, Q3 2025 | Prominent in mid-2025 and the stated rationale for the May 2025 price increase; impact was called more modest than feared by Q3 2025 and faded thereafter, resurfacing only as one reason to exit butter's international supply chain. |
| Share repurchase program | emerged | Q4 2025, Q1 2026 | First-ever buyback ($100 million, two years) authorized in Q4 2025; the company executed $20 million in Q1 2026 even as it moved toward drawing the revolver. |
| Butter business | dropped | Q2 2024, Q3 2024, Q4 2024, Q1 2025, Q4 2025, Q1 2026 | Relaunched from Irish supply in 2024 and repeatedly cited as a growth pillar; the company announced a full exit in Q1 2026, ending shipments toward year-end. |
| Family farm network expansion | persisted | Q2 2024, Q3 2024, Q4 2024, Q1 2025, Q2 2025, Q3 2025, Q4 2025 | Steady recruitment (roughly 350 farms in mid-2024 to more than 600 by end-2025). The relationship reversed in Q1 2026 as the company began paying some farmers to pause production. |
Guidance ledger
Quotes, calls, and speakers are source-verified; outcomes are curator-classified.
| Verbatim guidance | Call | Speaker | Curator outcome | Outcome note |
|---|---|---|---|---|
| “we continue to expect net revenue of at least $740 million or at least 22% growth versus 2024 and adjusted EBITDA of at least $100 million or at least 15% growth” | Vital Farms, Inc., Q1 2025 Earnings Call, May 08, 2025 · 2025-05-08T12:30:00 | Thilo Wrede | kept | FY2025 came in at $759.4 million net revenue and $114 million adjusted EBITDA, both above these at-least floors. |
| “we are raising our full year 2025 net revenue guidance to at least $775 million, representing growth of at least 28% versus 2024” | Vital Farms, Inc., Q3 2025 Earnings Call, Nov 04, 2025 · 2025-11-04T13:30:00 | Thilo Wrede | missed | FY2025 net revenue was reported at $759.4 million, below this at-least-$775 million bar; the outlook was revised down at the December Investor Day. |
| “we're introducing a new net revenue guidance range of $900 million to $920 million, representing more than 20% growth” | Vital Farms, Inc., Q4 2025 Earnings Call, Feb 26, 2026 · 2026-02-26T13:30:00 | Thilo Wrede | missed | Cut three months later to $775 million to $800 million on the Q1 2026 call as price gaps pressured volumes. |
| “we are setting adjusted EBITDA guidance to be within a range of $105 million to $115 million this year” | Vital Farms, Inc., Q4 2025 Earnings Call, Feb 26, 2026 · 2026-02-26T13:30:00 | Thilo Wrede | missed | Slashed to $0 million to $10 million on the Q1 2026 call, reflecting about $32 million of supply-management costs and deeper price investment. |
| “Finally, we expect CapEx of $140 million to $150 million in 2026” | Vital Farms, Inc., Q4 2025 Earnings Call, Feb 26, 2026 · 2026-02-26T13:30:00 | Thilo Wrede | missed | Lowered to $70 million to $75 million on the Q1 2026 call by slowing Vital Crossroads and pausing accelerator-farm construction. |
| “We now expect net revenue of $775 million to $800 million and adjusted EBITDA of $0 million to $10 million” | Vital Farms, Inc., Q1 2026 Earnings Call, May 07, 2026 · 2026-05-07T12:30:00 | Thilo Wrede | pending | The revised FY2026 outlook; no subsequent call in the supplied history to judge the result. |
| “We currently anticipate gross margin to return to 30% by late fourth quarter and underlying adjusted EBITDA margin to get back to double-digits in 2027” | Vital Farms, Inc., Q1 2026 Earnings Call, May 07, 2026 · 2026-05-07T12:30:00 | Thilo Wrede | pending | Forward recovery targets stated in Q1 2026; not yet testable against the supplied call history. |
Q&A pressure map
Question counts and firms are curator tallies; analyst coverage shown above.
| Topic | Questions | Firms | Pressure / response |
|---|---|---|---|
| Margin recovery and where EBITDA bottoms | 3 | Stifel, Nicolaus & Company, D.A. Davidson, Morgan Stanley | On the Q1 2026 call analysts repeatedly probed the credibility of a 2027 return to double-digit EBITDA and the size of the 2026 trough. Management gave the Q2 magnitude (negative, mid- to high-teens) but, on whether the long-term target survives a new-normal environment, reframed rather than reaffirming it directly. |
| Balance sheet, liquidity and covenants | 1 | Craig-Hallum Capital Group | A single but pointed line of questioning on the Q1 2026 call about funding the year; management confirmed it will draw the revolver and disclosed the 3.5x net-leverage and 1.35x fixed-charge covenants. |
| Oversupply management scope and cost | 2 | Stifel, Nicolaus & Company, The Benchmark Company | Analysts pressed on the split between breaker-channel dumping and paid farmer contract amendments and on alternative outlets for excess eggs; management detailed the cadence and the roughly $32 million full-year cost. |
| Price gaps and the path back to volume growth | 3 | D.A. Davidson, Morgan Stanley, Mizuho Securities | Repeated questions on the Q1 2026 call about how much of the second-half recovery comes from narrowing gaps versus new distribution, and whether the pressure is on existing buy rates or first-time trial. |
| Butter exit and Vital Crossroads pause | 2 | TD Cowen, BMO Capital Markets | Analysts questioned exiting a growing butter business and slow-rolling the Seymour facility; management framed both as capital-discipline moves preserving optionality rather than strategy reversals. |
Language shifts
Only language evidence verified against the referenced component is shown.
| Observation | Verbatim evidence | Call ID | Component |
|---|---|---|---|
| For years management dismissed price gaps as immaterial to demand, a stance held as recently as late 2024. | “price gaps have very limited impact on our demand and our growth opportunity” | 1901683527 | 13 |
| That dismissal persisted into Q3 2025, when the CFO again downplayed gaps even as he acknowledged they had widened. | “what drives our growth is not price gaps” | 1966871927 | 19 |
| In Q1 2026 the language reverses completely, with price gaps named as the cause of the shortfall. | “price gaps reached levels that our brand could not sustain” | 1997151440 | 2 |
| New 'reset' framing enters the vocabulary, distinguishing a lowered near-term outlook from unchanged long-term ambition. | “we see this as a reset of our expectations for 2026, but not a reset of our ambitions” | 1997151440 | 2 |
| The register shifts from growth investment to cost and cash discipline. | “adapting quickly to this new more pressured environment by reducing price gaps, addressing our cost structure and managing cash” | 1997151440 | 2 |
| Management explicitly frames 2026 as a cyclical low point for margins, new caution absent from prior calls. | “we view 2026 as a low watermark for margins in this cycle” | 1997151440 | 2 |
The call history's clearest signal is a reversal: after several years of insisting price gaps were immaterial and running an aggressive, supply-constrained growth build, management conceded in Q1 2026 that gaps had broken trial, slashed 2026 guidance, and pivoted to cost cuts, a butter exit, slowed capacity spend and a revolver draw. The open questions the transcripts leave for the investment debate are execution and credibility, whether the promised 2027 margin recovery and volume reacceleration arrive, and whether the balance sheet is adequate through a first-half-loss year.
Where the story stands
Vital Farms sells pasture-raised eggs at a premium to conventional eggs. Between fiscal 2021 and 2025 revenue nearly tripled to $759 million and the business swung from break-even to $66 million of net income. Then the share price fell roughly 75% from its August 2025 high to about $13. This chapter orients a reader new to the name and frames what the rest of the report works through: how much of that growth was the brand, and how much was the price of ordinary eggs.
What the company sells
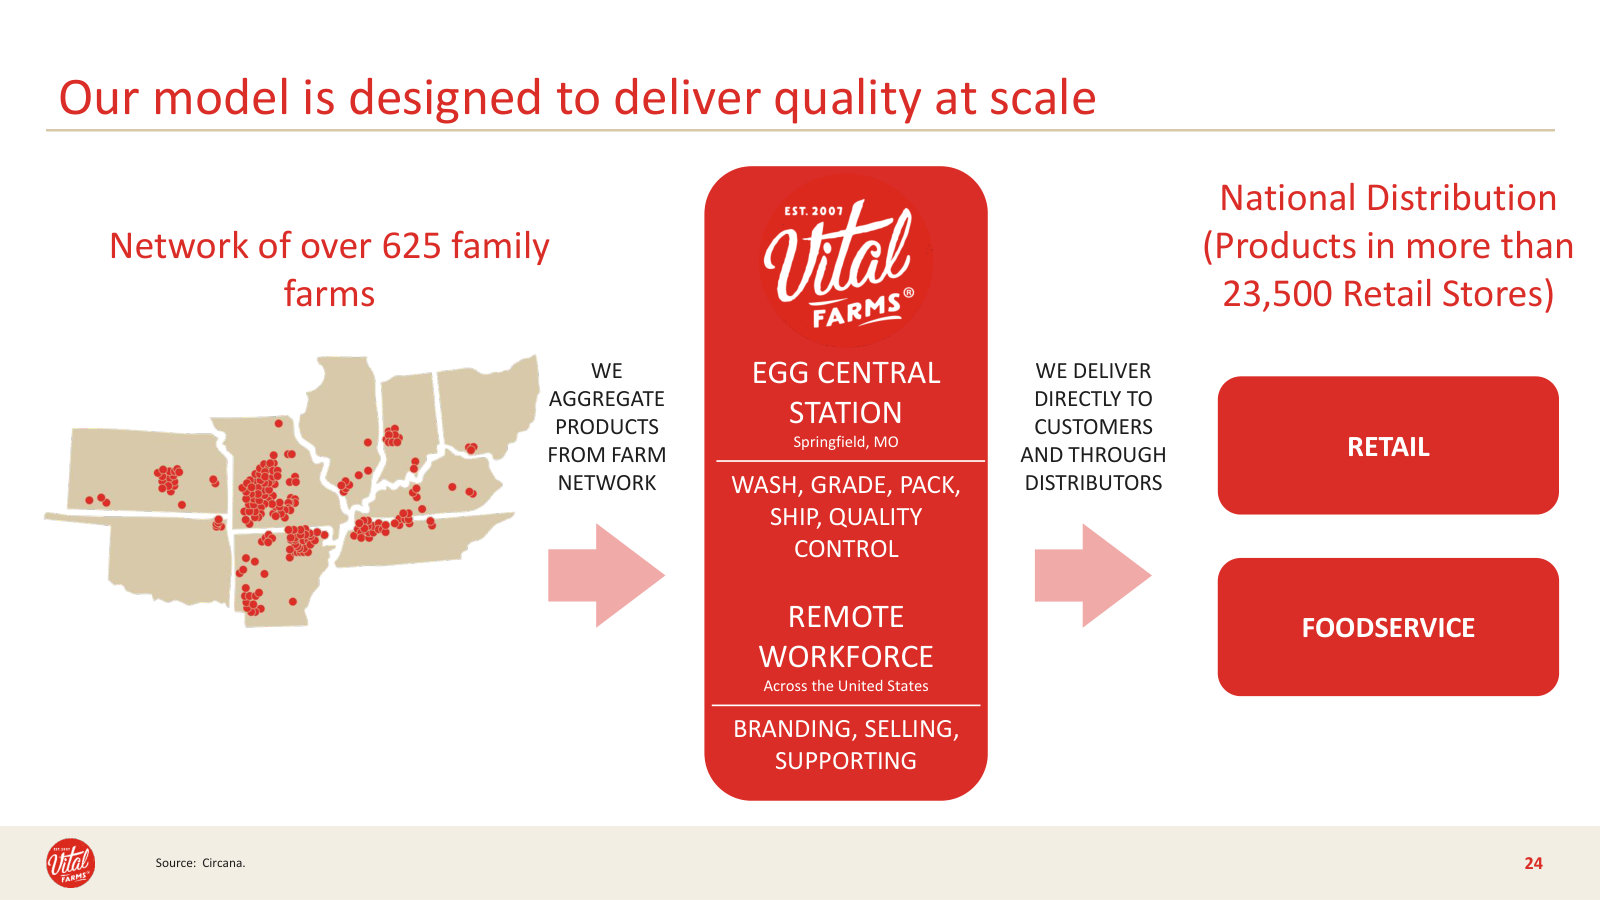
Vital Farms was founded in 2007 on a 27-acre plot in Austin, Texas, and is today a Delaware public benefit corporation and Certified B Corporation that sources eggs and butter through a distributed supply chain of small farms [1]. Rather than own large flocks, it contracts a network of more than 600 small family farms that meet its pasture-raised animal-welfare standard, then washes, grades and packs the eggs itself [2]. Shell eggs are the business: they were about 93% of net revenue in fiscal 2025, with butter and other products making up the rest [3].
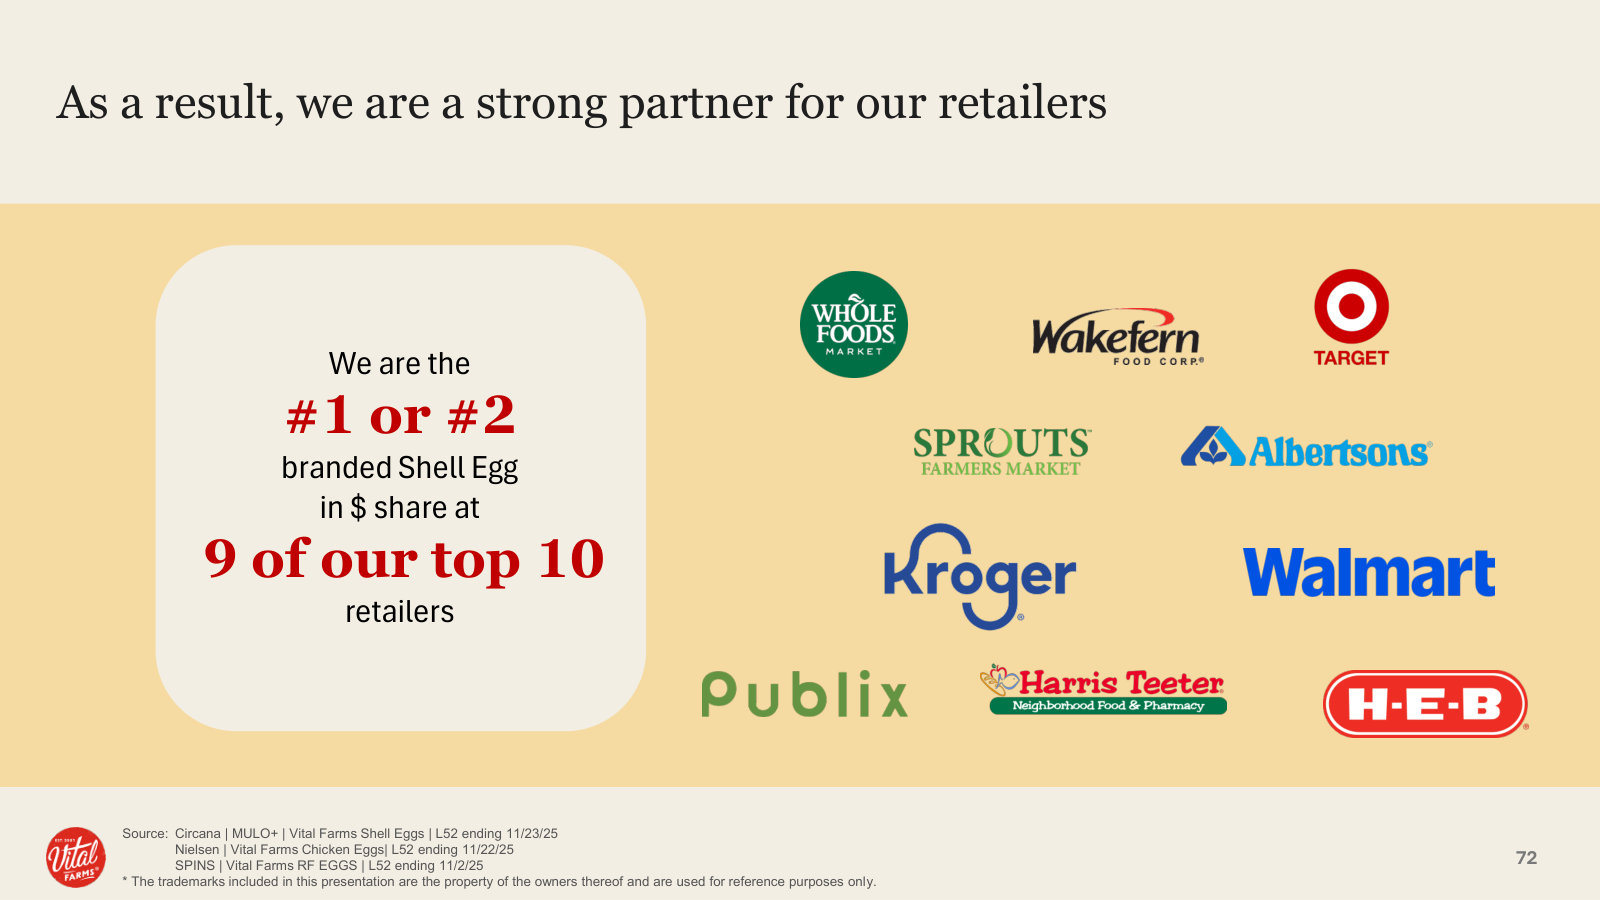
The product reaches consumers through mainstream and natural grocers — Kroger, Publix, Target, Walmart, Sprouts and Whole Foods among them. As of December 2025 Vital Farms was the number one or two branded egg by retail dollar sales at nine of its ten largest customers [4]. Processing runs through Egg Central Station in Springfield, Missouri — capable of packing more than 7.5 million eggs a day — and the company is building a second automated facility, Vital Crossroads, in Seymour, Indiana [5].
Share Price
Market Cap ($M)
Trailing P/E
FY2025 Revenue ($M)
FY2025 Revenue Growth
Cash, No Debt ($M)
Source: FY2025 Annual Report (Form 10-K) and reported market data; price and shares as of July 24, 2026 [6].
Five years of compounding
The financial record is unusual for a fresh-food company. Net revenue rose from $471.9 million in fiscal 2023 to $606.3 million in 2024 to $759.4 million in 2025 — the tail end of a run that lifted revenue from $261 million in 2021, a compound rate above 30% a year [7]. Profitability arrived with scale: operating income went from essentially zero in 2021 and 2022 to $88 million in 2025, as gross margin widened from about 30% to the high-30s.
Source: FY2021–FY2025 Annual Reports (Form 10-K), Consolidated Statements of Operations, as reported [8].
The balance sheet keeps pace with the income statement. At the end of fiscal 2025 Vital Farms held $48.8 million of cash against $351 million of equity and no funded debt; the drop in cash from $151 million a year earlier reflects spending on the Indiana facility, not losses. For an investor who wants the chance of bankruptcy near zero, that is the first thing worth knowing: the company does not owe anyone money, and it earns its way. A full financial history — three years back and consensus estimates forward — is left to its own chapter rather than compressed here.
The re-rating
The stock tells a different story than the income statement. Vital Farms came public in 2020, drifted for three years, then ran from roughly $12 in early 2023 to an all-time high of $52.47 in August 2025 as the growth and margin numbers above landed. From that peak it has fallen about 75%, with most of the decline concentrated between the February 2026 full-year report and the spring, and it now trades near $13 — close to its 52-week low.
Source: company share price history, as reported.
What broke
The premium Vital Farms charges is priced against conventional eggs, and for two years that reference point moved in its favor. Recurring outbreaks of highly pathogenic avian influenza thinned the supply of conventional eggs; in fiscal 2024 and 2025 those disruptions "resulted at times in increased demand for premium egg products such as ours," at points emptying competitors' shelves [9]. When ordinary eggs are scarce and expensive, the extra dollars for pasture-raised look smaller, and new shoppers try the brand.
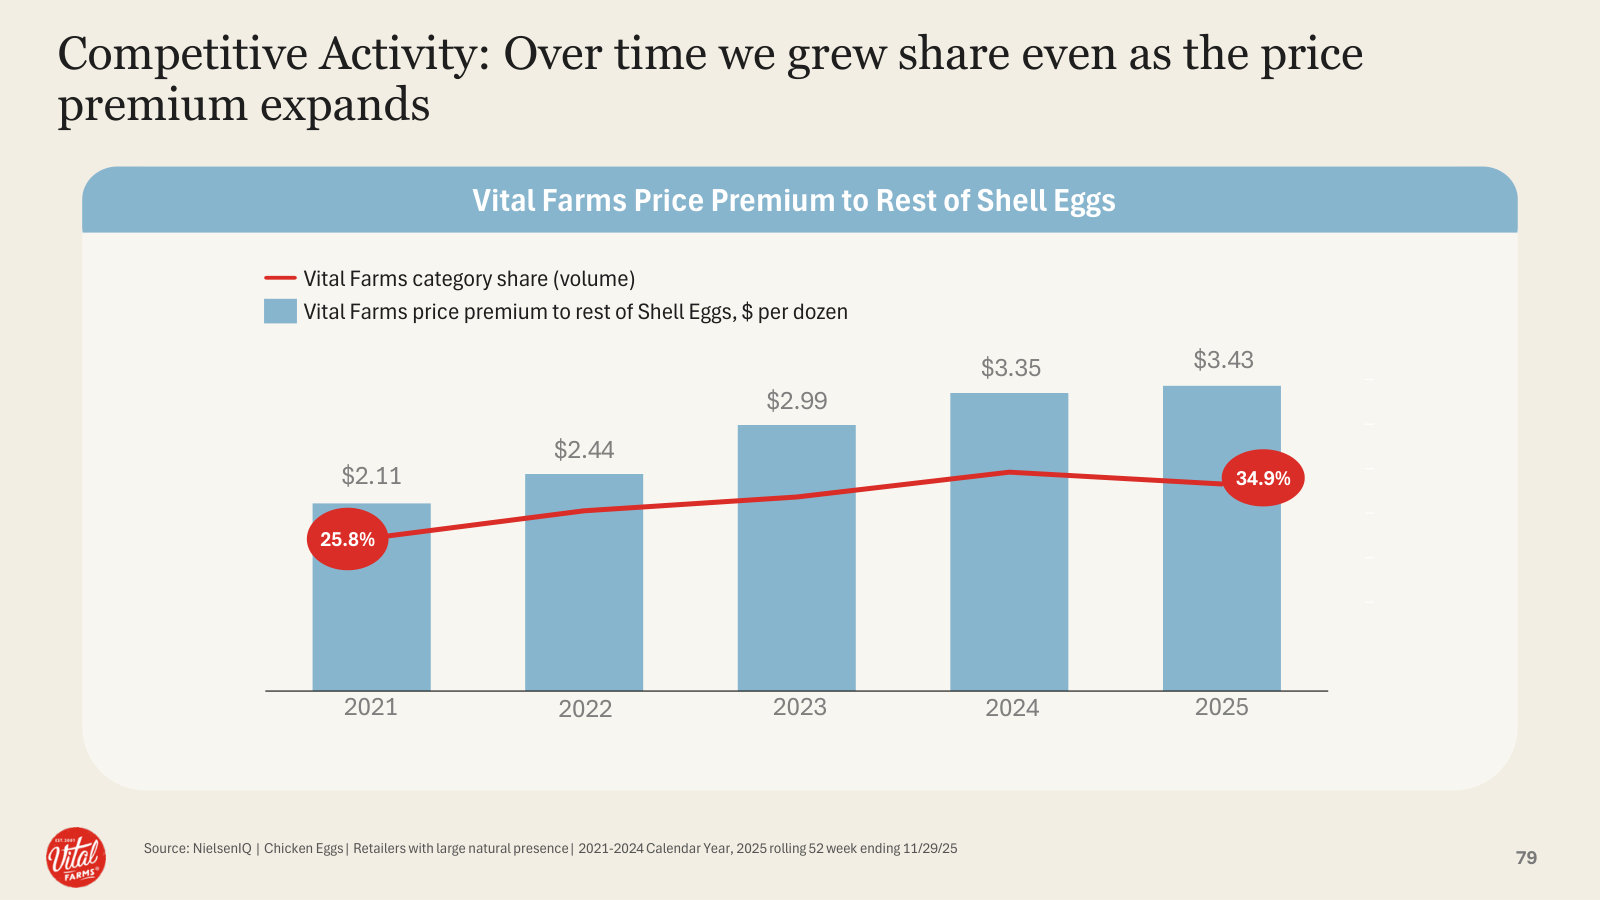
In early 2026 that reversed. Conventional egg prices fell faster than underlying costs, and the gap between Vital Farms and the shelf around it widened to levels management said it had not seen before. Existing buyers stayed loyal, but first-time trial dropped — households new to the brand fell from more than 55% of buyers in 2024 and 2025 to about 50% in the first quarter of 2026 — and velocity slowed enough that the company cut its full-year guidance [10]. Management's own evidence frames both the problem and its fix: in markets where the price gap widened most, volume growth turned negative, and at one top-10 customer, narrowing the gap from about 35% to 25% above competing premium eggs lifted volumes 18% in two weeks [11]. Closing that gap means giving back price and margin in a year the company is also funding a new plant — which is why consensus now expects roughly flat revenue and a small loss in fiscal 2026 before a return to growth in 2027.
Source: FY2024–FY2025 Annual Reports (Form 10-K), as reported, and consensus analyst estimates for FY2026–FY2027 [12].
Consensus carries a fiscal-2026 loss of about $0.42 a share against $1.44 earned in 2025, recovering to roughly $0.44 in 2027 — a reset year, on the current read, rather than a broken business.
The read this report tests
Two reads compete. In the first, Vital Farms is a durable, category-leading brand whose collapsed price reflects a temporary, largely self-fixable widening of its premium to conventional eggs. In the second, much of the 2023–2025 surge was a cyclical windfall from avian-flu-inflated egg prices that is now unwinding, leaving a slower, thinner-margin business than the peak implied. The evidence for the first read is real trial and shelf leadership built over years and a debt-free balance sheet that makes the reset survivable; the strongest fact against it is that the same price gap the company now blames for stalling growth is the one that flattered it on the way up. What would settle it is whether narrowing the gap restores new-household trial without permanently resetting margins lower — the thread the chapters that follow pick up.
Financials and Estimates
Over FY2023–FY2025 Vital Farms turned a break-even business into a real one: revenue rose from $471.9M to $759.4M, gross margin held near 38%, and diluted EPS went from $0.59 to $1.44. The forward picture is the mirror image — company guidance and consensus both point to FY2026 as a margin and earnings trough, with a partial recovery in FY2027. The forward numbers turn on whether that trough is real or still being cut.
The three-year record
The trailing three years are the strongest in the company's public history. Net revenue compounded at roughly 27% a year, but the more important change is below the top line: the FY2022 operating margin was 0.6% — essentially break-even — and by FY2025 it was 11.6%. Gross margin stepped up from ~30% to ~38% and stayed there. This is a business that earned an 18.9% return on equity in FY2025, not the marginally-profitable grower it was three years earlier.
FY2025 Revenue ($M)
Gross Margin
Operating Margin
Diluted EPS
Return on Equity
Source: FY2025 Annual Report (Form 10-K), Consolidated Statements of Income [1]; return on equity derived from reported financials.
Source: FY2023–FY2025 Annual Reports (Form 10-K), Consolidated Statements of Income [2].
A detail inside the FY2025 top line matters for what comes next. Of the $153.1M revenue increase, $78.3M came from volume and $74.9M from price/mix [2]. Roughly half of last year's growth was price, at a time when inflated conventional-egg prices let the company hold a wide premium. That is the same lever now running in reverse (The Egg Premium).
Margins expanded, then held
The five-year margin path shows the inflection clearly. Gross margin fell in FY2022 as input costs spiked, then recovered and expanded to a high-30s plateau. Operating and net margins moved from near-zero to double digits over the same span — the difference between a company covering its costs and one generating meaningful profit.
Source: derived from reported financials, FY2021–FY2025 Annual Reports (Form 10-K), Consolidated Statements of Income [3].
Cash conversion inverted in FY2025
For most of this period Vital Farms converted profit to cash cleanly: free cash flow was positive $39.4M in FY2023 and $36.2M in FY2024. FY2025 broke that pattern. Operating cash flow fell to $33.7M — held back by a working-capital build, with inventory rising from $23.7M to $66.5M — while capital expenditure jumped to $82.0M as the Vital Crossroads plant construction ramped [4]. The result was negative free cash flow of $48.2M. The cash outflow was a growth investment, not an operating loss — but it drained the balance sheet at the same moment demand was slowing.
Source: FY2021–FY2025 Annual Reports (Form 10-K), Consolidated Statements of Cash Flows [5].
The balance sheet absorbed it without stress. Cash fell from $150.6M to $48.8M over FY2025 — almost entirely the capex step-up — but the company still ended the year with $351.3M of equity, $149.4M of retained earnings, and no funded debt [6]. That debt-free position is what makes a loss-making year survivable rather than existential.
The forward view: a guided trough
The forward numbers are where the case turns. Following a weak first quarter, management cut FY2026 guidance to net revenue of $775M–$800M and adjusted EBITDA of just $0–$10M [7]. Vital Farms' windfall was cheap first-time trial (new-buyer share above 55% in 2024-2025 falling to 50% in Q1 FY2026), not pricing on its own shelf, and it is that trial reversal that drove management to cut FY2026 adjusted-EBITDA guidance from $105-115M to $0-10M in one quarter — so the 4.8x trailing EV/EBITDA that makes the stock look cheap divides by a $114M FY2025 peak the company no longer guides to. The valuation chapter develops that denominator in full (Valuation and Scenarios). Revenue therefore still grows modestly off FY2025's $759.4M; profit is what collapses. Consensus lines up almost exactly: FY2026 revenue of $775.3M (+2.1%) and a diluted loss of about $0.42 per share, versus the $1.44 earned in FY2025.
Sources: FY2024–FY2025 actuals per Consolidated Statements of Income [8]; FY2026–FY2027 consensus estimates, as reported.
Both the company and the Street then call for FY2026 to be the low point. Management describes 2026 as "a low watermark for margins in this cycle," expects underlying gross margin back to 30% by late Q4, and adjusted EBITDA margin back to double digits in FY2027 [9]. Consensus agrees on shape: FY2027 revenue of roughly $848.6M (+9.5%) and EPS back to about $0.44.
Sources: company FY2026 guidance per Q1 FY2026 earnings call [10]; consensus estimates, as reported.
What Q1 FY2026 actually showed
The first quarter is the evidence behind the reset. Net revenue of $187.2M still grew 15.4%, but gross margin fell to 28.3% from 38.5% a year earlier, and the company swung to a $1.5M net loss from $16.9M of net income; adjusted EBITDA was $5.0M (2.7% of revenue) against $27.5M (16.9%) the year before [11]. The margin damage is a mix of a widened price gap forcing promotional and price investment, and roughly $32M of one-year "supply management" costs — selling excess eggs into the low-value breaker channel and paying farmers to pause production — that management expects to concentrate in the first half [12].
Management is defending cash rather than earnings this year: FY2026 capex was cut by roughly $75M — chiefly by slowing the Vital Crossroads build and pausing the accelerator farms — to a $70M–$75M range, the butter business is being exited (freeing about $25M of cash and lifting gross margin 150–200bps from 2027), and remote headcount was reduced about 10% [13]. Even so, free cash flow is expected to stay negative in FY2026, funded from the existing cash and investment position and the credit facility. The company held $51.4M of cash and marketable securities with no debt at quarter-end, and repurchased over one million shares for $20M with $80M of authorization remaining [14].
The FY2026 trough, still moving
The bull reading is straightforward and, on the current evidence, defensible: revenue keeps growing, the FY2026 profit collapse is driven by identifiable and largely one-year costs, the balance sheet carries no debt, and both management and consensus model a return to positive EPS and double-digit EBITDA margin in FY2027. Nothing in the three-year record suggests the underlying model stopped working — the FY2022–FY2025 margin build was real.
The counter-fact sits in the estimates themselves. Ninety days before this snapshot, consensus had FY2026 EPS at about +$1.01 and FY2027 at +$1.31; today those are -$0.42 and +$0.44 (consensus estimates, as reported). The trough has been cut repeatedly, and the guidance that anchors it is explicitly conditional: it assumes retail prices and price gaps stabilize at current levels, and warns that further erosion would require more price investment and additional cost [15].
The recovery case rests on FY2026 being a genuine floor. The main risk to that read is that the floor keeps moving: forward EPS has already been revised from a FY2026 profit to a loss in one quarter, and the guidance holds only if price gaps stop widening. What would settle it is two or three quarters of stabilizing velocity and gross margin tracking back toward the 30% the company targets for late Q4.
What the price implies
At $13.02, Vital Farms carries a market value near $599M against roughly $51M of net cash — an enterprise value around $548M, or about 0.7 times FY2025 revenue. On trailing FY2025 earnings the multiple is about 9 times; on the consensus FY2027 recovery EPS of $0.44 it is closer to 30 times, and FY2026 has no positive earnings to divide by. The analyst mean price target of $12.00 sits slightly below the current quote, in a $10–$16 range.
Share Price ($)
Market Cap ($M)
Net Cash ($M)
P/E (Trailing FY2025)
Price / FY2025 Sales
Analyst Mean Target ($)
Sources: share price, market capitalization and analyst targets per consensus data, as reported; net cash and sales multiple derived from FY2025 Annual Report balance sheet and income statement [16].
The multiple is undemanding on trailing numbers and on sales, and unremarkable on the FY2027 recovery earnings — which is another way of saying the stock is priced close to the trough it is being asked to work through, with limited premium for the recovery holding. For an investor sizing margin of safety, the debt-free balance sheet is the anchor; the open question is how many more quarters the reset takes and how deep the earnings floor finally proves to be.
Ownership and Incentives
The value case for Vital Farms is most sensitive to a margin and EBITDA recovery by fiscal 2027. The people who have to deliver it are paid, and part-own the company, in ways that line up with that outcome — but the founder has been stepping back. Matt O'Hayer trimmed his stake from 27.4% at the 2021 IPO to 16.3% and retired from the board in February 2026 [1]. Against that, the FY2025 long-term equity grant vests only on FY2027 net-revenue and EBITDA-margin targets, and nearly the whole board bought stock in the open market as the price fell.
The founder steps back, but stays the largest owner
Matthew O'Hayer founded Vital Farms in 2007 with, by the company's telling, twenty hens, and pioneered the pasture-raised category [2]. In February 2026 he retired as Executive Chairperson and left the board, converting to a non-employee advisory role under a March 2026 resignation agreement for which he received no compensation in FY2025 [3]. His reported beneficial ownership has declined steadily across successive Schedule 13G/A filings — from 27.4% in 2021 to 16.05% by November 2025 — and stood at 16.3%, or 7,024,402 shares, in the April 2026 proxy [4].
Source: SEC Schedule 13G/A filings 2021–Nov 2025, as reported; April 2026 figure per the 2026 Proxy Statement [5].
Two readings sit inside that line. The bearish one: a founder who cut his holding by roughly eleven percentage points and left the board in the same window the avian-flu price-gap windfall began to unwind. The offsetting facts are that the sell-down was gradual and spread over five years — most of it well before the 2026 collapse — and that at 16.3% he remains, by a wide margin, the largest single holder, ahead of BlackRock at 12.6% and Vanguard at 6.5% [6]. A retiring 68-year-old founder diversifying a concentrated position is ordinary; the fact worth watching is whether the pace of reduction accelerates now that he no longer sits on the board.
Who runs it now
On O'Hayer's retirement the board elected Russell Diez-Canseco — CEO since 2019 and a company operator since 2014 — to the added role of Executive Chairperson, so the chair and chief-executive titles are now combined in one person [7]. Combining the roles cuts against the board-independence a governance-minded investor prefers, and the board is classified into three staggered classes, a structure that slows any change of control [8]. Both are mitigated rather than absent: seven of the eight directors are independent, with Diez-Canseco the sole non-independent member because of his combined role [9].
The independent bench is well-matched to a packaged-food scale-up. Glenda Flanagan spent nearly three decades as CFO of Whole Foods, and Denny Marie Post, former CEO of Red Robin, serves as Lead Independent Director [10]; William Cyr is CEO of Freshpet [11]; and Kelly Kennedy, the audit chair, was CFO of The Honest Company [12]. This is a board that has run grocery distribution, natural-foods income statements and consumer brands through their own cycles.
What management is paid to do
The compensation design is where alignment with the reset is most concrete. For FY2025 the committee dropped stock options entirely and set executive equity at 50% performance stock units and 50% time-vesting RSUs. The PSUs cliff-vest after a three-year period ending with fiscal 2027 and pay out between 0% and 200% of target based, in equal halves, on fiscal-2027 net revenue and fiscal-2027 Adjusted EBITDA Margin in the company's existing product categories [13]. Those two metrics are what separate the value case from the value trap: whether revenue holds and whether the margin structure rebuilds after the 2026 trough. Management's largest pay component only converts to shares if the recovery the case depends on actually arrives.
The annual cash bonus behaved the same way in FY2025. It was tied 50/50 to net revenue and Adjusted EBITDA and earned at 93% of target — the revenue half paid 84% because actual net revenue of $759.4M fell short of the $784.5M target, while the EBITDA half paid 103% on $114.0M against a $113.4M target [14]. Pay moved down when a goal was missed, which is the point of a formula.
Source: 2026 Proxy Statement, Summary Compensation Table, fiscal year 2025 [15].
The absolute numbers are modest for a company that earned $66M in FY2025. The CEO's total of $3.6M is roughly two-thirds equity and cash-incentive, and it fell from $6.0M in FY2024 — the prior year carried a larger one-time equity grant — so realized pay tracked the softer year [16]. The CEO-to-median-employee pay ratio is 44:1 against a median crew-member wage of $81,259, low for a public company of this profile [17].
The surrounding governance hygiene is clean. The company raised its stock-ownership guidelines in 2025 to five times salary for the CEO, two times for other officers and five times the cash retainer for directors; it has a clawback policy adopted in 2023, prohibits executive hedging, and permits pledging only with board approval, with no shares currently pledged [18]. Shareholders ratified the program with 93.1% support at the first say-on-pay vote in 2025 [19].
Insiders bought the drawdown
The clearest signal of conviction is what directors and officers did with their own money during the drawdown. Between March and June 2026 — as the shares fell through the low teens and into single digits — at least a dozen open-market purchases were filed by insiders, and no open-market sales. Nearly the entire independent board participated, along with several operating officers.
Source: SEC Form 4 filings, open-market purchases (transaction code P), March–June 2026, as reported.
The dollar amounts are not large — most directors bought roughly a retainer's worth, $20,000 to $50,000 — so this is a signal of confidence rather than a needle-moving change in ownership. It is worth weighting for two reasons. First, it is broad: it is not one insider but almost the whole board and several officers acting within days of each other. Second, the operating officer closest to the cost structure, Chief Supply Chain Officer Joseph Holland, made the single largest buy, 12,484 shares at $8.00, at a time when the margin recovery was still an open question. The main caveat is that it says nothing new about the founder, who was not among the buyers and continues to hold a diminishing, if still dominant, stake.
What would change the read
The alignment picture is favorable on balance: management's long-term equity is tied to the fiscal-2027 revenue-and-margin recovery, pay flexed down when FY2025 revenue missed, governance controls are in place, and insiders bought the drawdown. The evidence that would revise it is specific and checkable. If O'Hayer's Schedule 13G/A filings show the sell-down accelerating now that he has left the board, that would weaken the founder-conviction leg. If the FY2026 or FY2027 PSU targets are later reset lower — the kind of disclosure that appears in the following year's proxy — the pay-for-recovery link would loosen. And the corporate buyback that ran alongside negative free cash flow (Financials and Estimates) sits in tension with these same insiders spending personal cash on the stock: the first draws the balance-sheet cushion, the second does not.
Category and Moat
The pasture-raised egg category is a genuine, durable tailwind, and Vital Farms still leads it. Measured by volume rather than by inflated retail dollars, pasture-raised has been the fastest-growing corner of the egg aisle for five years — and it kept growing in 2026 even as commodity egg prices collapsed. But leadership is loosening: the company's own disclosed share of the pasture-raised segment fell from roughly 90% to just over half in three years, and it stopped publishing the figure. The moat is the farm network and the brand, not ownership of the category.
The tailwind is real, and it is a volume story
Vital Farms sells into a category that is expanding fast on every measure the filings offer. Per Circana data in the FY2025 10-K, U.S. pasture-raised retail sales reached roughly $1.3 billion in 2025, compounding at 37.5% a year since 2021; the broader specialty-egg market (pasture-raised plus free-range) was about $12.6 billion at a 26.4% CAGR, against a total shell-egg market of $15.4 billion growing 21.3% [1]. Those dollar growth rates flatter the story, because the same avian-flu spike that ran through this report's earlier chapters lifted the price of every egg in the count. The cleaner read strips price out and looks at volume.
On a volume basis the category ranking is unambiguous. The company's December 2025 Investor Day put five-year segment volume CAGRs side by side: pasture-raised grew 27% a year from 2020 to 2025, free-range and cage-free each 12%, while conventional eggs — still the overwhelming majority of the market — shrank 6% [2].
Source: December 2025 Corporate Presentation (Investor Day), egg category volume growth rates [3].
The most direct test of whether the shift is secular or was merely a flu-price windfall came in the first quarter of 2026, when conventional eggs were the cheapest they had been in years. Management reported that premium "outdoor access" eggs — free-range and pasture-raised combined — had grown from 8% of category volume in 2023 to 15% by early 2026, and that year-to-date those eggs were growing 32% in volume against 4% for mainstream eggs, "despite the lowest price in years" [4]. The tailwind, in other words, did not reverse when the cyclical price gap did. That is the load-bearing point for the through-line: the category the reset thesis depends on is still compounding, and Vital Farms' problem in 2026 was not a shrinking pond.
The runway is also still long. Vital Farms' shell eggs reached about 10.5% of U.S. households in 2025 — up from 3.6% at the 2020 IPO — against category household penetration near 97% [5]. Nine in ten American households buy eggs; barely one in ten yet buys this brand.
The moat shows up in the farm network and the shelf
Vital Farms remains the number-one U.S. pasture-raised brand, the number-one natural-channel egg brand, and the number-two U.S. egg brand of any kind by retail dollar sales [6]. The question a professional investor should press is whether that position rests on anything a well-funded competitor cannot simply buy. Two things pass the test; one is more fragile than the brand's ranking suggests.
The first is the supply chain. Vital Farms sources from a network of more than 600 small family farms concentrated in the "Pasture Belt," the region where hens can be kept outdoors year-round [7], and it describes this as "one of the largest sourcing and distribution networks of family farms" it believes it operates [8]. The network is contractually locked: buy-sell contracts covered all of the laying hens in the network at year-end 2025 [9]. Recruiting a farmer is not cheap or quick for a rival, either: the company requires each contracted farm to build and equip to its specifications, "which requires a significant upfront capital investment" [10]. Feeding that network into scale is Egg Central Station, the company's owned processing plant in Missouri, capable of packing more than 7.5 million eggs a day [11]. A competitor can build a plant; assembling hundreds of certified pasture farms under contract is the slower part.
The second is the brand, and it shows up in numbers rather than adjectives. Even through the 2026 price shock, existing buyers did not leave: units per retained household ran 2% above the prior eight-quarter average, and consumers "generally resisted trading down to lower priced alternatives" [12]. Shelf productivity has long been the brand's calling card — at the IPO the company sold at roughly $241 per store per item per week in the natural channel against $110 for all other egg brands [13] — and retailers are still expanding placements: the company's total distribution points rose to about 150 exiting Q1 2026 from 116 a year earlier, with management guiding toward 170–175 by year-end, its best distribution year since going public [14]. Retention held and shelf space grew during the worst quarter of the cycle, which is what a defensible brand looks like in the numbers.
Leadership of the category is narrowing
The fragile part is share. As the category grew, Vital Farms' disclosed share of it fell year after year, and the company eventually stopped publishing the figure.
Sources: Vital Farms 10-Ks FY2021 [15], FY2022 [16], FY2023 [17], FY2024 [18] and FY2025 [19].
The company reported an 88% share of the U.S. pasture-raised retail egg market in 2021 [20], over 90% in 2022 [21], over 85% in 2023 [22], and just over 54% in 2024 [23]. The FY2025 10-K dropped the share figure entirely, keeping only the "#1" ranking [24].
Two caveats keep this from being a clean 90-to-54 collapse. The data provider changed from SPINS to Circana between the 2023 and 2024 disclosures, the phrasing shifted from "market" to "segment," and the measured category itself nearly doubled in dollars over the same window ($531 million to $994 million), so part of the apparent drop reflects a bigger, differently-defined denominator rather than lost cartons. But the direction is not in doubt: the company disclosed the share every year through 2024, and it dropped the figure in the same period the number was falling rather than rising. The honest read is that Vital Farms is still the clear leader of pasture-raised, but no longer close to the whole of it.
Who took the rest is the more useful question, and the FY2026 commentary answers it more precisely than the 10-K's competition paragraph. The price gap that actually stalled Vital Farms' velocity in 2026 was not the gap to conventional eggs — it was the gap to other premium eggs. Management described bringing one top-10 customer's price premium down "from about 35% above a group of competing premium branded outdoor access eggs to about 25%," after which volumes rose 18% in two weeks [25]. The competition is now intramural: other branded outdoor-access eggs and private-label pasture-raised lines, not caged commodity eggs. That is a meaningful refinement of the surge-and-stall mechanism laid out in The Egg Premium — the sensitive variable is Vital Farms' premium over its premium rivals, a gap a rival can widen by pricing down.
Behind that pressure sits a competitor with resources Vital Farms cannot match. The company names Cal-Maine Foods as a competitor in its own filing [26]. Cal-Maine is the largest U.S. egg producer, with roughly $2.9 billion of net sales in its fiscal 2026 (year ended May 2026) — about four times Vital Farms' revenue [27].
Pasture-raised category, 2025 retail
Vital Farms net revenue, FY2025
Cal-Maine net sales, FY2026
Sources: pasture-raised category and VITL — FY2025 10-K [28]; Cal-Maine net sales — CALM FY2026 10-K [29].
More important than the size gap is what Cal-Maine is doing with it. Its stated growth strategy prioritizes expanding specialty shell-egg capacity — the classification under which it books pasture-raised eggs [30]. It already owns the Egg-Land's Best and Land O'Lakes branded specialty lines — Egg-Land's Best was the third best-selling dairy brand in the U.S. in 2025 [31] — and it buys its way into more capacity relentlessly: 28 acquisitions since 1989, including Echo Lake Foods ($289.5 million), Creighton Brothers ($129.3 million), ISE America and Clean Egg all closed in its FY2025–FY2026 [32]. This is the well-funded competitor the moat test asks about, and it is actively adding the one asset — specialty and pasture capacity — that would let it press Vital Farms' premium.
The read
The category is not the risk; it is the opportunity, and it is durable. Pasture-raised has out-grown every alternative by volume for five years and kept growing when the flu-driven price prop fell away, and Vital Farms sits at 10.5% household penetration in a category that reaches nearly every home — a long runway on a real secular shift. The risk is the second-order consequence of leading a fast-growing category: it draws capital and competitors. Vital Farms' defensible assets — the contracted family-farm network and a brand that retains its buyers and wins shelf space — are hard to copy quickly and are the reason to expect it to keep growing volumes. What those assets do not defend is share of the category or the size of the premium, both of which are already compressing.
The strongest fact against a bearish reading of the share slide is that it has not touched the base: through the 2026 shock, existing households bought slightly more, resisted trading down, and retailers added distribution [33]. Only trial is contested, and trial is a function of price gap the company says it can manage geography by geography. What would change the read in either direction is observable: re-disclosure and stabilization of pasture-raised share, with the premium to other outdoor-access brands holding as price gaps narrow, would confirm the moat protects pricing; continued silence on share and a premium that has to keep falling to hold volume would say Cal-Maine and private label are turning a differentiated brand into a commoditizing one.
Unit Economics
Vital Farms buys every egg its contracted farmers produce, whether or not it can sell them. That guarantee, paired with owned processing, lifted gross margin to about 38% by FY2025 — and turned into a roughly $32M drag in FY2026 when supply built for the avian-flu windfall met a demand slowdown [1]. Management has laid out a specific recovery bridge; its pieces are largely quantified, but the biggest lever — the retail price it can hold — is the one it controls least.
How a dozen makes money
Vital Farms does not own hens. It works with more than 600 family farms almost entirely through buy-sell contracts: the farmer funds the birds, the feed, and the working capital, and Vital Farms agrees to buy all of that farm's egg production at a price set by pallet weight and "adjusted quarterly for changes in feed cost" [2]. The eggs are then washed and packed at Egg Central Station, the company's owned plant in Springfield, Missouri, which management says now carries more than $1 billion of revenue capacity [3].
Three forces set the gross margin. The first is feed — corn and soybean meal — which flowed through to roughly $125 million of cost of goods sold in FY2025 and reaches the income statement about a quarter after it moves, through the contract's quarterly reset [4]. The second is the price gap to commodity and competing premium eggs, which sets how much of the premium the brand can actually collect. The third is fixed-cost absorption at Egg Central Station: the more dozens run through an owned plant, the lower unit processing cost falls. Together they carried gross margin from 30.2% in FY2022 to 37.6% in FY2025.
Source: computed from reported net revenue and cost of goods sold, FY2021–FY2025 Consolidated Statements of Income [5]; FY2025 MD and A [6].
The FY2025 margin was a genuine level, not an accounting artifact: gross profit rose 24% to $285.7 million, and the slight dip from FY2024's 37.9% came from labor and overhead added to scale the business, "partially offset by favorable price/mix benefits" [7]. Price/mix is the line that carries this: some of that 38% was the premium the brand could collect while conventional eggs were expensive. When that reversed, so did part of the margin.
The buy-all guarantee cuts both ways
The contract that guarantees supply also guarantees a cost when demand falls short. The FY2025 10-K states it plainly: "We contract with family farms to purchase all of their egg production for the duration of our contracts. We are contractually obligated to purchase these eggs irrespective of our ability to sell such eggs" [8]. The same page warns that in past oversupply episodes the company "sold or donated our excess supply at reduced prices or no cost" [9].
That is exactly what happened in 2026. Capacity added for the 2024–2025 windfall — more contracted farms, higher flock placements — met a demand slowdown, and the eggs it could not sell at retail had to go somewhere. Two levers absorb an overhang, and both are expensive:
- The breaker channel. Excess shell eggs are sold to egg-breaking processors at commodity prices — "as low as $0.10 per dozen" in Q1 FY2026, a near-total loss against retail. Selling above the normal breaker share cut Q1 gross profit by about $4.9 million on its own [10].
- Paying farmers not to produce. Because it cannot simply cancel the purchase obligation, Vital Farms is amending producer contracts to "cease production from existing flocks or delay placement of future flocks, in return for payments to such farmers, reflecting a portion of their foregone profits" [11].
Together these "supply management costs" are guided at roughly $32 million for FY2026, all booked in cost of goods sold [12]. The distinction that matters for a value reader: this is not an external shock like avian flu. It is the cost of the company's own supply running ahead of demand, made unavoidable by the buy-all model. The same structure that secures a differentiated egg supply also means Vital Farms — not its farmers — carries the cost of guessing volume wrong.
One accounting nuance keeps the drag from being cleanly confined to 2026. Breaker losses hit the quarter they occur, but the farmer-contract-amendment payments fall under lease accounting and are amortized "over the next several years," with cash paid in installments across the non-producing period [13]. Part of the 2026 supply cost is therefore a tail that bleeds into 2027 and beyond.
The Q1 FY2026 margin bridge
The overhang shows up starkly in the first quarter. Gross margin fell to 28.3% from 38.5% a year earlier — a little over ten percentage points — even as revenue grew 15.4% [14]. The decline was not a pricing failure at shelf so much as the cost of clearing eggs the company was contractually bound to buy.
Excess breaker sales cut gross profit about $4.9M — roughly 2.6 percentage points of the 10.2-point decline; the remainder combines other supply-management costs, higher promotional activity and mix, which management gave directionally rather than as a full split. Source: Q1 FY2026 earnings call, CFO remarks [15].
Reported price/mix turned negative by $9.7 million, "primarily driven by a higher-than-anticipated volume contribution from the breaker channel" — the mix effect of dumping eggs at $0.10, not a cut in shelf prices [16]. Underneath it, the retail brand still commands its premium: the same quarter showed a top-10 customer's price gap narrowed from about 35% to about 25% above competing premium outdoor-access eggs, lifting volume 18% in two weeks [17]. Demand is there at the right gap; the margin damage is the overhang.
Whether the recovery bridge closes
Management has been unusually specific about the path back: underlying gross margin to "return to 30% by late fourth quarter" of 2026, and adjusted EBITDA margin "back to double digits in 2027" — explicitly assuming price levels hold where they are now [18]. The levers behind that bridge are identifiable, and most are quantified.
Source: Q1 FY2026 earnings call, CEO and CFO prepared remarks [19] [20].
Two features of that list are worth weighing. In its favor: the components are concrete and mostly one-directional, and the fixed-cost engine is real — Egg Central Station already holds more than $1 billion of revenue capacity, so recovering volume onto an existing plant is high-incremental-margin, and management is slowing the Indiana build precisely to avoid layering in premature fixed cost [21]. The model demonstrably produced 37–38% gross margins and a 15% adjusted-EBITDA margin in FY2025, so 30–35% is not hypothetical.
Against it: the 30% figure is an exit rate for late Q4 2026, not a full-year number — 2026 as a whole sits well below it, and the year is explicitly back-half-weighted on actions still to take hold [22]. More important, the single largest swing factor is price, and management concedes the plan "assumes that we will have to maintain the current level of pricing investments through the balance of the year" [23] — if premium egg prices erode further, "we will incur additional costs that will reduce revenue and profit" [24]. The bridge is engineered on a price floor the company does not set.
The ambition against which to read all of this moved twice in five months. At its December 2025 Investor Day, management raised its long-term bar — from an earlier target of $1 billion of net revenue by 2027 at "a gross margin of at least 35% and an EBITDA margin of 12% to 14%" [25] to $2 billion of net revenue by 2030 at 35%+ gross margin and a 15–17% adjusted-EBITDA margin [26]. Two months later it cut FY2026 to an adjusted-EBITDA range of $0–$10 million — a margin near half a percent at the midpoint — while insisting the long-term targets stand: "a reset of our expectations for 2026, but not a reset of our ambitions" [27] [28].
FY2026 gross margin shown is the "late Q4" exit-rate target, not the full-year figure; FY2026 EBITDA margin is the $0–$10M guidance midpoint on ~$787.5M revenue. 2030 gross-margin target stated as "35+%". Sources: FY2025 Consolidated Statements of Income [29]; Q1 FY2026 earnings call [30]; December 2025 Investor Day [31].
The gap on the right of that table is what the recovery has to close. The gross-margin recovery is a few hundred basis points of cost work plus volume onto a plant that can hold it — the kind of thing a competent operator with an intact brand delivers. The EBITDA-margin recovery, from roughly half a percent to 15–17%, is a far larger climb that depends on volume, price discipline, and cost-out arriving together. Reasonable to model as a trough; harder to underwrite as a straight line.
What would settle it
The bridge is falsifiable quarter by quarter. Underlying gross margin should track toward 30% by Q4 2026; supply-management costs should peak in Q2 (concentrated in excess breaker sales) and decline after [32]; breaker volume should return toward its ~4.9% historical share of egg volume [33]; and revenue-generating price/mix should turn positive as the price-gap actions reach shelf. If those move on schedule, the 30% exit and the 2027 double-digit EBITDA margin are within reach on the company's own arithmetic. If premium egg prices keep falling, the same buy-all contract that built the margin will keep charging for the overhang — and the bridge lengthens.
Durable vs Cyclical
Over FY2021–FY2025 Vital Farms added roughly $498 million of net revenue — about 61% from volume and 39% from its own price increases [1] [2]. The cyclical slice the 2026 reset exposed is not a price windfall on Vital Farms' own shelf but a trial windfall: avian-flu-inflated commodity prices made trying the brand cheap, and in 2024–2025 more than 55% of buyers were brand-new households. As the premium re-widened, new-buyer share fell to 50%, and FY2026 revenue is guided to just +2% to +5% despite a record distribution year [3].
This chapter decomposes the growth that separates the fallen-star read from the value-trap one: how much of the FY2021–FY2025 build was durable, and how much was a cheap-trial window that is now closing.
The four-year revenue bridge
The split between volume and price is disclosed each year in the 10-K, and it is volume that did most of the work. Across the four annual steps, volume contributed roughly $306 million and price/mix roughly $193 million of the ~$498 million added.
Source: FY2022–FY2025 10-Ks, Results of Operations [4]; [5]; [6]; [7].
Revenue Added FY21→FY25 ($M)
From Volume
From Price/Mix
Source: derived from FY2022–FY2025 10-K revenue-driver disclosures [8].
Two features matter for the durability question. First, the mix of drivers moved year to year rather than following commodity egg prices: FY2023 was the one price-led year (+$59.4 million price versus +$50.5 million volume, of which a 53rd week added $8.5 million) [9], while FY2024 — the peak avian-flu year — was three-quarters volume (+$103.0 million volume versus +$31.5 million price) [10]. If high commodity prices had simply inflated Vital Farms' own realized price, the price line would have swelled in 2024; instead volume did.
Second, the price/mix that did land came from Vital Farms' own list actions, not from riding the commodity spike. The FY2023 gross-margin bridge attributes the gain to "pricing increases across the entire shell egg portfolio in January 2023" [11], and FY2024 to "price increases on our organic egg portfolio in January 2024" plus fully realizing the February 2023 increase [12]. These are administered price moves that hold when commodity eggs cheapen — a different kind of durability than a spot-price windfall.
A trial windfall, not a price windfall
The cyclical exposure sits inside the volume line, through trial. Avian-flu outbreaks inflated conventional and, in turn, competing premium egg prices; that compressed Vital Farms' relative premium and lowered the cost of trying the brand for the first time. Management quantified the effect directly: in 2024 and 2025 more than 55% of its buyers were households that had not purchased Vital Farms before, and that new-buyer rate dropped to 50% in the first quarter of 2026 as price gaps widened again [13].
Source: Q1 FY2026 earnings call ("more than 55%" in 2024–25, "just 50%" in Q1 2026) [14].
The reversal runs through the same channel that the surge did. Management notes that where price gaps to outdoor-access competitors widened most, volume growth turned negative; where gaps stayed moderate, growth held. Narrowing the gap at one top-10 customer from about 35% to about 25% above competing premium eggs lifted volume 18% in two weeks [15]. The read is most sensitive to Vital Farms' premium over other premium branded and private-label eggs, not over conventional eggs: narrowing that gap moves volume within weeks, as the top-10-customer example shows, and it is a refinement of the price-gap mechanism the Category and Moat chapter first surfaced. That gap is set partly by competitors who followed commodity eggs down to multi-year lows in 2026, which is why the trial engine is cyclical and not fully in Vital Farms' hands.
The durable engine
The other engine is structural and still running. The clearest evidence is that the base did not crack when trial stalled: through the 2026 shock, existing households bought about 2% more per retained household than the prior eight-quarter average, and resisted trading down [16]. Vital Farms shell eggs reach roughly 10.5% of U.S. households against a category at 97.3%, so the penetration runway is set by awareness and distribution rather than by the price cycle [17].
The December 2025 investor day framed the durable-engine metrics against 2020, before the flu cycle: household penetration 11.9% (up 6.2 points), household retention 51% (up 5 points), aided brand awareness 33% (up 16 points), average items carried per retailer up 43%, shelf velocity up 68%, across 23,680 stores [18].
Source: December 2025 Investor Day, brand and retailer metrics versus 2020 [19].
Distribution is the piece of that engine most clearly independent of the price cycle, and it kept accelerating while velocity fell. Total distribution points averaged 115.8 in Q1 2025, 144.8 in Q4 2025 and 149.8 in Q1 2026, with management guiding to 170–175 by Q4 2026 — what it expects to be its single best yearly distribution gain since going public [20].
Source: Q1 FY2026 earnings call; 4Q26 is the midpoint of the 170–175 guide [21].
Sizing the unwind
The FY2026 guide measures how large the trial reversal is relative to the durable engine. Revenue is guided to $775–800 million, or +2% to +5% over FY2025's $759.4 million, including the record distribution year above [22]. Set against three prior years of 25%–39% growth, a low-single-digit result while distribution posts its best-ever gain implies the stalled trial-and-velocity engine is currently offsetting most of what a record distribution year would otherwise add.
FY2025 Revenue ($M)
FY2026 Guide, Midpoint ($M)
Implied Growth (mid)
Source: Q1 FY2026 earnings call guidance ($775–800M) against FY2025 actual [23].
Management's own plan is for the two engines to re-cross within the year: distribution gains take full effect in the back half, price-gap narrowing restores velocity, and revenue-generating volume growth turns positive in the third quarter and accelerates into the fourth [24]. That path is conditional: it assumes competing premium and breaker prices hold at current levels, a floor the company does not set — the same price-floor dependency the Unit Economics bridge rests on.
Balance of the evidence
The weight of the four-year record is durable. Most of the $498 million added was volume, the price/mix that landed was administered rather than commodity-driven, and the base-loyalty, penetration, retention and distribution metrics all built through and past the flu cycle. On that reading, the reset is a demand-mix event on an intact franchise, and the fallen-star framing fits better than the value-trap one.
The qualification is real and current. A visible share of 2024–2025's acceleration was cheap trial acquired while the premium was compressed, and that trial is reversing fast enough that, in 2026, it neutralizes even a record distribution year — with the decisive input, competitors' pricing, outside Vital Farms' control. The read would strengthen if new-buyer share climbs back toward the 55%-plus level as gaps narrow and revenue-generating volume turns positive in the second half; it would weaken if velocity stays negative in the wide-gap geographies and the distribution gains cannot carry the top line on their own.
Valuation and Scenarios
At $13.02 a share (July 24, 2026) Vital Farms carries a market capitalization near $599 million and — net of $51 million of cash and no debt — an enterprise value around $548 million. That is 9x trailing earnings and under 5x trailing adjusted EBITDA, cheap only if fiscal-2025's $114 million of EBITDA is repeatable. What that multiple divides by, not the price, separates a cyclical peak from a deeper, slower reset. Vital Farms' windfall was cheap first-time trial (new-buyer share above 55% in 2024-2025 falling to 50% in Q1 FY2026), not pricing on its own shelf, and it is that trial reversal that drove management to cut FY2026 adjusted-EBITDA guidance from $105-115M to $0-10M in one quarter — so the 4.8x trailing EV/EBITDA that makes the stock look cheap divides by a $114M FY2025 peak the company no longer guides to [1] [2] [3].
On the denominator the company actually guides to — about $5 million for fiscal 2026 — the same $548 million enterprise value is roughly 110x, not a meaningful multiple; on the $114 million peak it is 4.8x. The distance between those two numbers is the valuation question, and the rest of this chapter works it. The people who set the moving denominator are not reading it as pure downside: the FY2025 executive equity grant, half of it in performance shares, vests only on fiscal-2027 net revenue and Adjusted EBITDA Margin [4], and nearly the whole board and several officers bought stock in the open market through the drawdown (Ownership and Incentives).
What the market pays
Share price
Market cap
Enterprise value
Net cash (no debt)
Source: share price and market cap from market data, as reported; net cash is cash, cash equivalents and marketable securities of $51.4 million with no debt at March 29, 2026 [5].
On about 46 million diluted shares, the equity is worth roughly $599 million, and because the balance sheet holds no funded debt the enterprise value is simply that figure less the $51.4 million of cash and securities [6]. The debt-free framing that anchors the value case (Financials and Estimates) is real, but the cushion is thinner and moving faster than a static snapshot shows: cash and securities were $113.4 million at the December 2025 year-end [7] and fell $61.9 million in the first quarter alone — to $51.4 million — as capital spending, working capital and $20 million of buybacks all drew on it while operating cash flow ran to negative $18.6 million [8]. Management expects free cash flow to stay negative this year and to fund it partly by drawing the $60 million credit facility [9]. The cushion still exists, but it is being drawn down rather than held.
The earnings the multiple rests on
Sources: FY2023 ($48.3M) and FY2024 ($86.7M) adjusted EBITDA [10]; FY2025 ($114M) and the initial FY2026 guide of $105M–$115M [11]; revised FY2026 guide of $0M–$10M [12].
The trailing 4.8x rests on $114 million — the highest adjusted EBITDA in the company's history and more than double the $48.3 million earned two years earlier, a ramp that coincided with avian-flu-inflated conventional egg prices (Financials and Estimates). The instability of that denominator is not a matter of interpretation: the company's own guidance for the very same metric fell from $105–$115 million in February 2026 to $0–$10 million in May 2026 — roughly a $105 million cut in a single quarter — as about $32 million of oversupply-management cost and stepped-up price investment landed on the year [13] [14]. So the cheap trailing multiple is priced on a level of profit the company no longer expects to earn in the current year.
Forward, the multiples invert. On fiscal-2026 consensus the stock shows a loss, so trailing cheapness gives way to a per-share deficit; on fiscal-2027 consensus the earnings return but the multiple is nearly 30x.
| Multiple | Trailing FY2025 | FY2026E | FY2027E |
|---|---|---|---|
| P/E | 9.0x | n.m. (EPS −$0.42) | 29.6x (EPS $0.44) |
| EV / adjusted EBITDA | 4.8x | n.m. (~$5M guided) | ~6.4x* |
| EV / net sales | 0.72x | 0.70x | 0.65x |
FY2027E EV/EBITDA applies management's stated "double-digit adjusted EBITDA margin" in 2027 (~10% on ~$850M consensus revenue) [15].
Sources: FY2025 actuals — $114 million adjusted EBITDA, $66.3 million net income [16]; FY2026 guided adjusted EBITDA and the 2027 margin path [17]; FY2026/FY2027 consensus EPS and revenue from consensus estimates, as reported.
What the price implies
The two ends of that table bracket the debate, and the enterprise value implies a level of durable profit that sits between them. Working the enterprise value backwards: at $548 million, a low-double-digit EV/EBITDA multiple typical of a growing packaged-food brand — take 10x as an illustration — implies roughly $55 million of sustainable adjusted EBITDA. That is about half fiscal-2025's $114 million peak and roughly eleven times the $5 million guided for fiscal 2026. At today's price the market is paying neither for the peak nor for the trough; it discounts a partial recovery to something near a 7% EBITDA margin — below the 15% the business reached in fiscal 2025 and well above the 0.6% midpoint guided for this year.
Anchoring instead on fiscal 2027 — the first year management expects a double-digit EBITDA margin — and flexing the margin and exit multiple gives a spread wide enough to hold both the value and the value-trap reads at once:
| Scenario | FY2027 adj. EBITDA (margin) | EV/EBITDA | Implied EV | Implied value/share | vs $13.02 |
|---|---|---|---|---|---|
| Bear | ~$40M (5% on ~$800M) | 6x | ~$240M | ~$6 | −52% |
| Base | ~$85M (10% on ~$850M) | 8x | ~$680M | ~$16 | +22% |
| Bull | ~$117M (13% on ~$900M) | 11x | ~$1.29B | ~$29 | +123% |
Source: illustrative scenarios derived from management's FY2027 double-digit-EBITDA-margin target and 2030 model [18] [19]; each adds $51M net cash on ~46M shares. Not forecasts.
The base case ties to management's own recovery arithmetic: at roughly $85 million of fiscal-2027 EBITDA, today's enterprise value is about 6.4x that figure — undemanding if the recovery lands. The bull case leans on the December 2025 Investor Day target of $2 billion of revenue at a 15–17% adjusted EBITDA margin by 2030 [20], a bar the company itself raised even as it cut the near term — a $1 billion / 2027 goal became a $2 billion / 2030 goal [21]. The bear case needs no catastrophe, only for the recovery to arrive later and shallower than planned.
The sell-side prices a tighter, nearer band. The mean and median analyst target is $12.00 — slightly below the $13.02 quote — inside a $10 to $16 range, and the rating mix has moved to 1 strong buy, 2 buy and 7 hold; three months earlier eight of twelve ratings were buys. The downgrade cluster mirrors the guidance cut. Those are twelve-month targets, which is why they sit near the current price rather than reaching for the multi-year model.
Source: analyst price targets, ratings and consensus revisions from consensus estimates, as reported.
Bull and bear on the same facts
The case is genuinely two-sided because the same facts read two ways. The report's prior chapters supply both columns.
| Shared fact | Bull reading | Bear reading |
|---|---|---|
| Debt-free, $51M net cash | Trough is survivable without financing; room to buy back stock | Cushion fell $62M in a quarter; FCF negative, revolver now contemplated |
| FY2025 adj. EBITDA $114M, 15% margin | Proven earning power to re-attain on an existing plant | Guided to ~$5M for FY2026; the peak was flattered by inflated egg prices |
| Pasture-raised volume +27% CAGR; VITL the leader | Durable secular tailwind; only 10.5% household penetration | Disclosed share fell from over 90% to over 54% then vanished from the filing |
| Retention intact; distribution 145→170–175 points | Brand moat holds; only new-trial is cyclical | Trial is half of growth and is exactly what stalled; it is price-gap dependent |
| Recovery bridge fully named (30% GM exit-2026) | Specific, quantified levers; insiders buying at $8–$18 | Assumes a retail price floor VITL does not set; farmer-cost tail runs past 2027 |
| Trailing 9x P/E, 4.8x EV/EBITDA | Cheap for a growing branded business | Multiples meaningless on a cyclical-peak denominator |
Sources: derived from the report's prior chapters — Financials and Estimates, Category and Moat, Unit Economics and Ownership and Incentives — and their cited filings; the FY2026 guidance cut and recovery bridge [22].
Where this leaves the read
At $13.02 the price already discounts a deep trough: it values the business at roughly half of fiscal-2025's earning power and about 6x a fiscal-2027 recovery that both management and consensus expect. Set against a brand whose existing-customer base held through the shock, a category still growing double digits by volume, and a balance sheet with no debt, the risk and reward skew modestly to the upside — provided the double-digit-EBITDA-margin recovery lands within about a year of the fiscal-2027 schedule. The evidence for that is the fixed-cost leverage in an owned plant already sized for more than $1 billion of revenue, and management and directors staking their pay and personal cash on the same 2027 outcome (Ownership and Incentives).
The strongest fact against it is the one this chapter opened on: the company's own EBITDA guidance for the current year fell by roughly $105 million in a single quarter, and the recovery bridge explicitly assumes outdoor-access egg prices hold at current levels [23]. The denominator under the cheap multiple is unstable, and a second leg down in premium egg prices would push the recovery out and keep free cash flow — and the cash cushion — draining. What would change the read is concrete: gross margin failing to track back toward the 30% exit rate management set for late fiscal 2026, or a further cut to the EBITDA path at the next print. Either would move the base case toward the bear column, and the price with it.
Capital and Runway
The debt-free balance sheet framed as the margin of safety ($48.8M cash, no funded debt, $351.3M equity at FY2025 year-end) saw its liquid cushion fall from $113.4M to $51.4M in a single quarter against disclosed twelve-month cash calls of roughly $105-140M that exceed even the cushion plus the full $60M revolver — and management has now stated it 'will start using the revolver,' so the anchor is converting from zero debt to an active draw. [1][2] The capital structure itself is unchanged — no funded debt, no maturities, and $330.9 million of equity at the end of the first quarter of 2026 [3], so the erosion is in the liquid part of the cushion, not in solvency. Management is spending that cushion on a buyback now roughly a third underwater even as it seeks to enlarge the credit line — the tension the rest of this chapter works through.
The cushion halved in a quarter
Vital Farms carries no funded debt, so the safety cushion is its liquid balance — cash, cash equivalents, and available-for-sale securities. That balance fell by $61.9 million between December 28, 2025 and March 29, 2026 [4]. The headline cash line barely moved — down $12.2 million — because the company liquidated roughly $50 million of securities to fund the quarter, cutting the investment-securities line from $64.5 million to $14.8 million [5]. The buffer, not the checking account, absorbed the drain.
Source: Q1 FY2026 Form 10-Q, Condensed Consolidated Balance Sheets [6].
The drain is a recent event, not a standing condition. Two years ago the business was self-funding: operating cash flow covered a modest capital budget and free cash flow was positive at $39.4 million in 2023 and $36.2 million in 2024 [7]. That reversed in 2025, when capital spending jumped to $82.0 million — against $28.6 million the year before — and free cash flow swung to negative $48.2 million even though net income rose to $66.3 million [8]. The reversal came from the two levers this report has already traced — the build-out of the second processing plant and a large inventory build ($47.8 million of the 2025 operating drain) — colliding with a demand air-pocket rather than from any deterioration in reported profit.
Source: FY2025 Annual Report (Form 10-K), Consolidated Statements of Cash Flows [9].
Where the quarter's cash went
The $61.9 million first-quarter drain splits into four buckets, and the discretionary ones are as large as the operating ones. Operating activities used $18.6 million — driven by a $28.8 million swing in working capital as inventory climbed from $66.5 million to $90.2 million into softening velocity [10]. Capital spending took another $20.8 million [11]. The share buyback took $20.0 million — nearly a third of the total drain — and finance-lease and tax-withholding payments the rest [12].
Source: Q1 FY2026 Form 10-Q, Condensed Consolidated Statements of Cash Flows [13].
The composition matters for the margin-of-safety read. Roughly two-thirds of the quarter's drain — the operating swing and the plant capex — is management's own to slow or reverse, and a large share of the operating piece is a one-time inventory build tied to the buy-all supply obligation covered in Unit Economics. The remaining third was a deliberate return of capital in a quarter when the company was already burning cash.
The twelve-month cash calls
The cushion sits against what the filing says the next twelve months will cost. Management lists, on the face of the 10-Q: $55–65 million of capital spending on the Vital Crossroads plant (already slowed), $35–50 million of supply-control costs, and a $15–25 million working-capital drag from advancing farm-recruitment payments that are then recognized over the roughly six-year contract terms [14][15][16]. Those disclosed calls total roughly $105–140 million over the next year — before any buyback — against $51.4 million of liquid resources and a $60 million untapped revolver, or about $111 million of total available liquidity [17].
Cash + Securities
Undrawn Revolver
12-Mo Cash Calls (low)
Buyback Remaining
Source: Q1 FY2026 Form 10-Q, Liquidity and Capital Resources and Notes [18][19]; supply-control and farm-recruitment ranges as disclosed.
Two facts qualify that arithmetic in opposite directions. In management's favor, most of those calls are discretionary or self-liquidating: the plant build can be — and is being — slowed, supply-control costs are trough-specific, and the farm-recruitment outlay converts into contracted egg supply. Management states it expects existing cash, operating cash flow, and revolver borrowings to fund operations for at least the next twelve months [20]. Cutting against it, the company also says it is "evaluating financing options… including an amendment to increase the total amount available under the Credit Facility" [21]. A debt-free company seeking a bigger debt line is telling the reader that the current $60 million backstop may not be enough for the plan it wants to fund.
The revolver's usable capacity is itself earnings-linked, which is the subtle part. The facility carries two covenants — a net-leverage ratio no greater than 3.25x and a fixed-charge coverage ratio no less than 1.35x — and an accordion capped at the greater of $35 million or 100% of adjusted EBITDA [22]. In a year the company guides to $0–10 million of adjusted EBITDA [23], both the coverage test and the EBITDA-scaled accordion tighten precisely when a cash-burning trough would make the company want to draw. Vital Farms had no balance outstanding and was in compliance at quarter-end [24], and it has used and repaid this line before — a $7.5 million draw and repayment ran through 2023 [25]. The point is not that the covenants bind today; it is that the $60 million "backstop" offers less unconditional protection in a loss year than its headline size implies.
The buyback against the burn
On February 19, 2026, the board authorized repurchasing up to $100 million of stock, about a sixth of the company's market value, through February 2028 [26]. In the quarter that followed it repurchased 1,001,747 shares at an average of $19.97, for $20.0 million, leaving $80 million authorized [27]. With the shares near $13 in late July 2026 (see Valuation and Scenarios), that first tranche is worth about $13 million — roughly a third below cost, a paper loss of about $7 million on the only capital the company has returned.
The tension is straightforward and worth stating once. Repurchasing stock funded by liquidating the securities buffer, in a quarter of negative operating cash flow, while simultaneously flagging a possible need to enlarge the credit line, spends the very margin of safety the thesis leans on. The charitable read is that management — alongside a board and officers buying personally on the open market, documented in Ownership and Incentives — is signalling that the stock is mispriced, and that $80 million of the authorization remains uncommitted and can be paused at will. The skeptical read is that $20 million already went out the door at a price a third above today's, and that dry powder returned to shareholders is dry powder not held against a trough of uncertain length.
Two facts qualify that call in opposite directions, and both belong in the same frame. Most of those outlays are discretionary or self-liquidating — the Vital Crossroads build is being slowed, supply-control costs are trough-specific, and farm recruitment converts into contracted egg supply — the company remains debt-free with no maturities, and management states existing liquidity will be sufficient to fund operations for at least the next twelve months [28]. On the Q1 pace, though — the liquid cushion down $61.9 million and operating cash flow using $18.6 million in the quarter — $51.4 million plus the $60 million revolver funds only a handful of quarters before the coverage covenant and the EBITDA-scaled accordion bind in a loss year, or an equity raise at a depressed price becomes the alternative. The squeeze reads as self-fixable rather than a solvency problem, but it is being spent into, not held.
What would change the read
On balance, the balance sheet is a genuine cushion but a conditional one. It is adequate for a short trough — the company is debt-free, has no maturities, is cutting discretionary capital spending, has paused development of future accelerator farms, and holds a revolver in reserve [29]. It is not adequate for an extended one: at anything like the first quarter's pace, the liquid buffer funds only a few quarters before the revolver — and its earnings-based covenants — has to carry a loss year, or an equity raise at a depressed price becomes the alternative.
The evidence points to a self-fixable squeeze rather than a solvency problem, and the strongest fact against that read is management's own move to seek a larger credit line. What would confirm the benign read: operating cash flow turning positive by late 2026 and the cash-plus-securities line stabilizing above the revolver, with the buyback paused rather than pressed. What would break it: a second guidance cut that forces a facility draw into the coverage covenant, a continued inventory build, or a decision to keep buying stock while the cushion shrinks. Those markers, and the operating ones that sit alongside them, are the subject a closing watch-list should carry.
What to Watch
This closing chapter turns the report's open questions into a dated, checkable watch-list. Two things are being tested at once: whether the 2026 reset reverses — the operating markers that show demand re-crossing to volume growth — and whether the debt-free cushion holds — the runway tripwires behind the balance sheet. Each marker carries management's own threshold and timing, so the recovery can be scored quarter by quarter against what the company itself promised, rather than against hope.
Two things being tested
Two questions carry the read a reader can now monitor with public data. The first is operational: does Vital Farms return to volume-led growth at a price premium its brand can sustain, or does trial stay stalled while the premium re-widens. The second is financial: does the liquid cushion stabilize, or does the burn force a drawn-and-upsized credit line into a loss-year covenant test. The first decides whether the business recovers; the second decides whether it can afford to wait to find out.
Management has been unusually specific about the shape of the recovery, which is what makes it checkable. It calls 2026 "a low watermark for margins in this cycle," expects the second quarter to be the bottom, and guides a back-half-weighted inflection as pricing actions, cost cuts, and distribution resets take hold [1][2]. A guide this precise sets its own falsification tests.
New-Buyer Share (%)
Q1 Gross Margin (%)
Q1 Adj. EBITDA Margin (%)
Cash + Securities
Sources: Q1 FY2026 earnings call [3][4]; Q1 FY2026 Form 10-Q, Liquidity and Capital Resources [5].
Operating markers: demand re-crossing
The single most load-bearing operating marker is revenue-generating volume, because it is where the demand air-pocket shows up first. It was negative in the first quarter; management guides it to turn positive in the third quarter and accelerate in the fourth as price cuts reach the shelf and distribution resets take effect [6]. The mechanism is narrowing the price gap to competing premium and private-label eggs: at one top-10 customer, cutting the gap from about 35% to about 25% lifted volume 18% within two weeks [7]. A third quarter that does not show this turn would be the clearest single sign the reset is deeper than a pricing adjustment.
New-buyer share is the leading indicator behind that volume line. More than 55% of buyers in 2024 and 2025 were households new to the brand; that dropped to 50% in the first quarter of 2026 as price gaps widened [8]. The durable-vs-cyclical split (Durable vs Cyclical) turns on whether that trial rate re-accelerates toward 55% once gaps narrow — the existing base is loyal, with units per retained household up 2%, so the recovery rides on trial, not retention [9].
Gross margin is the checkable summary of the cost side. It fell to 28.3% in the first quarter from 38.5% a year earlier, and management guides underlying gross margin back to 30% by late in the fourth quarter [10][11]. Two named levers sit behind the 2027 continuation: the butter exit is expected to add 150–200 basis points from 2027, and feed — roughly $125 million of 2025 cost of goods sold, flowing through the P&L with a one-quarter lag — is the larger target [12].
Source: Q1 FY2026 earnings call — Q1 actual and prior-year [13]; late-Q4 target [14].
The supply-management drag has a defined arc, which makes its roll-off a clean marker. Excess breaker sales — the fast way to shed an oversupply the buy-all contracts force the company to absorb (Unit Economics) — cut first-quarter gross profit by about $4.9 million, against a normal 2024–2025 breaker share of 4.9% of volume [15]. The full-year supply-management cost is guided at roughly $32 million, the vast majority landing in the second quarter, after which farmer-contract amendments — amortized over several years — carry a smaller running cost [16][17]. Breaker share returning toward 4.9% and the cost stepping down after the second quarter would confirm the oversupply is clearing.
Distribution is the one marker already moving the right way, and it is the cleanest test of the durable engine. The quarterly average of total distribution points reached 149.8 in the first quarter of 2026, up from 144.8 in the fourth quarter of 2025 and 115.8 a year earlier, and management guides 170–175 by the fourth quarter — its best yearly distribution gain since the IPO [18]. If distribution tracks to that range while volume stays soft, the constraint is velocity, not shelf presence — the read that trial, not the moat, is the swing factor.
Source: Q1 FY2026 earnings call, CEO prepared remarks [19].
The operating scorecard, with each threshold and the timing management put on it:
Sources: Q1 FY2026 earnings call — CEO remarks [20], CFO review [21] and outlook [22].
Runway tripwires: the cushion
The balance-sheet markers are fewer but higher-stakes, because they gate how long the operating recovery has to arrive (Capital and Runway). Operating cash flow used $18.6 million in the first quarter [23]; its return to positive is the tell that the trough is behind the business. Liquid resources — cash plus marketable securities — stood at $51.4 million against a $60 million untapped revolver, and management expects negative free cash flow for the year, funded from existing cash and the credit facility [24][25].
The revolver is the marker that has already changed since chapter 8's open question. On the call, the chief executive stated plainly, "We will start using the revolver," and confirmed the company had been in discussions with JPMorgan for several weeks [26]. The question is no longer whether the debt-free company draws its line — it has said it will — but how large the draw grows and how much headroom remains under the earnings-linked covenants detailed in Capital and Runway in a year guided to $0–10 million of adjusted EBITDA. A modest draw with room to spare is one read; a draw that needs the facility upsized is another.
The buyback is the revealed-preference marker. Of a $100 million authorization, $20 million was spent at an average $19.97 and $80 million remains [27]. Whether that authorization is paused or pressed while the cushion shrinks is the clearest signal of whether capital allocation prioritizes the safety cushion the bankruptcy-averse case depends on, or the mispricing bet.
Sources: Q1 FY2026 Form 10-Q — cash flows [28], liquidity [29] and buyback [30]; revolver commentary from the earnings call [31].
What would flip the read
The evidence points to a self-fixing squeeze rather than a solvency problem. Management controls the cost and distribution levers — the butter exit, feed work, headcount, capex slowdown, and a record distribution year — and has put dates on each. The strongest fact against that read is that the demand half of the recovery depends on prices the company does not set: it conceded it has no "clear visibility into the plans of other players in the marketplace," and its own guidance assumes competitor and breaker prices hold at current levels rather than eroding further [32][33].
Two near-term markers separate the base case from the bear case with the least ambiguity: revenue-generating volume turning positive in the third quarter, and operating cash flow stabilizing so the revolver draw stays modest. Both landing as guided supports the fallen-star read; volume staying negative into the fourth quarter while the cushion keeps draining supports the value-trap read. What would change the benign read is a second guidance cut — a risk management named explicitly, warning that if outdoor-access retail prices erode further it will spend more on price and incur additional cost [34]. The next two prints, against the thresholds above, decide which story is unfolding.