Vital Farms, Inc.'s management explains the business in its own materials. The slides below do the most of that work, pulled from the documents preserved in Sources. Each source link opens the complete presentation at that slide in a new tab.
Management's fullest statement of the business — brand, farm supply, processing capacity, retail and the 2030 plan to reach $2B in revenue. · Open the full document →
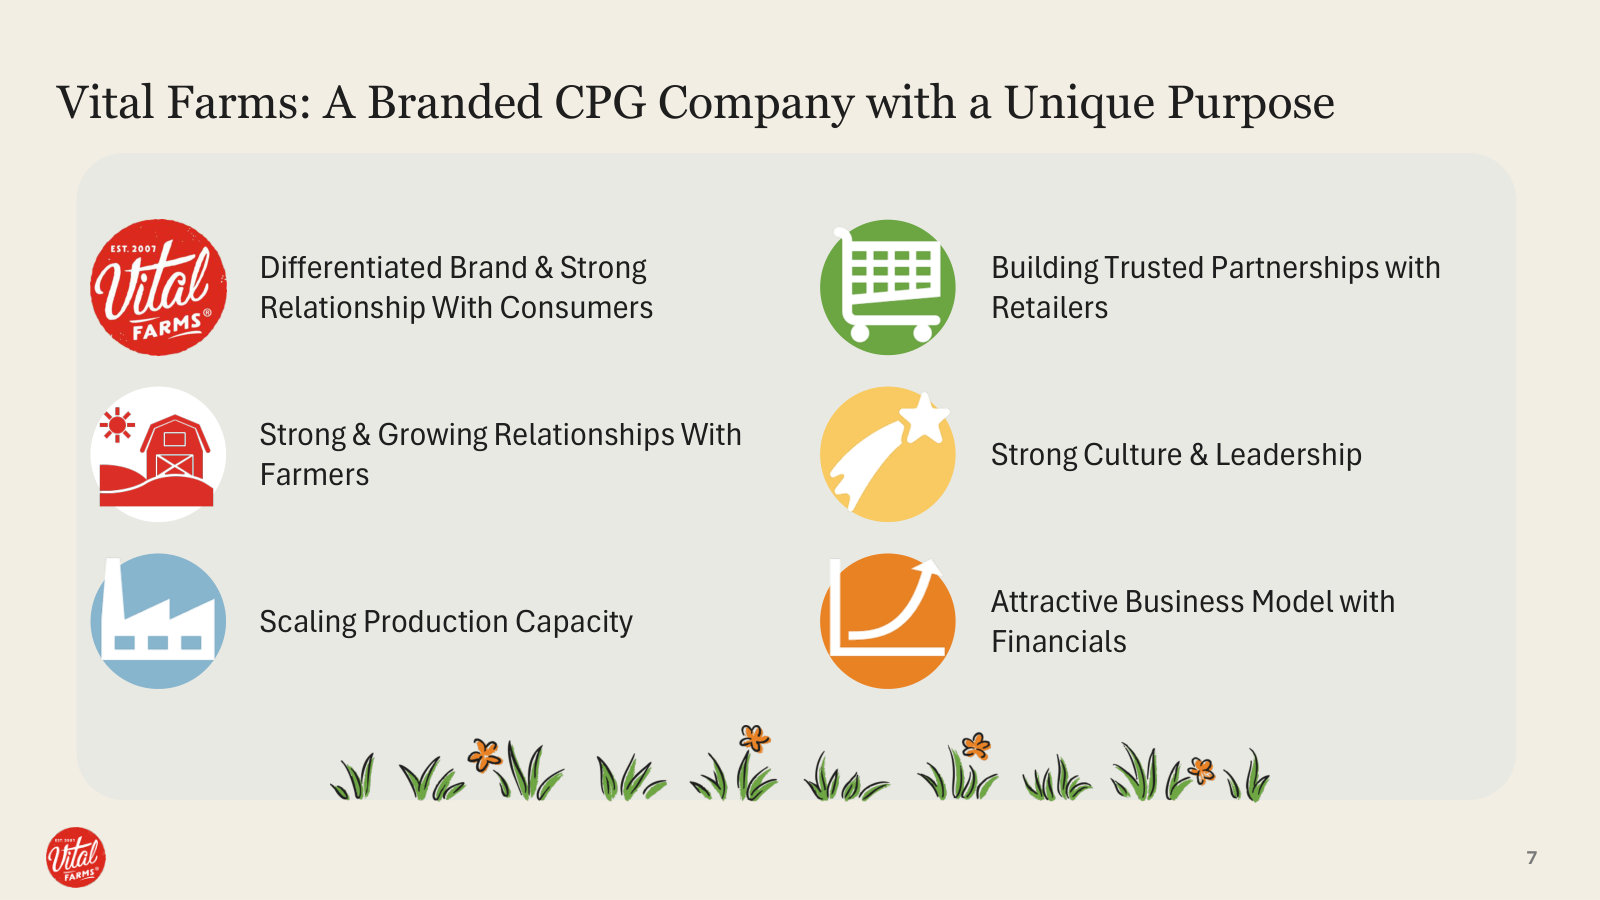
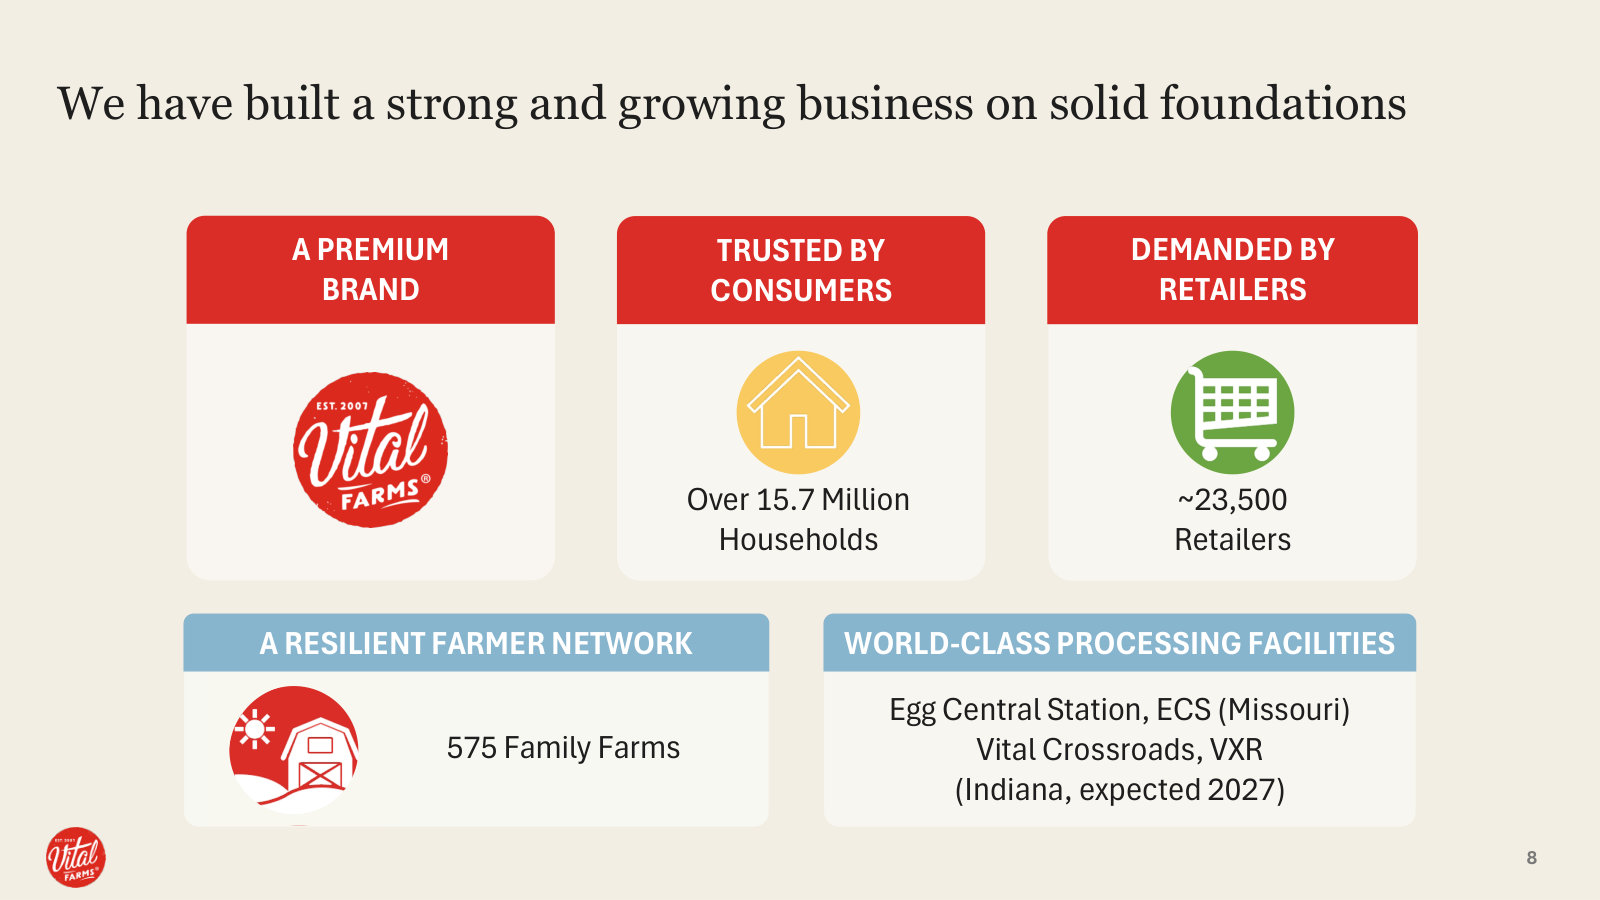
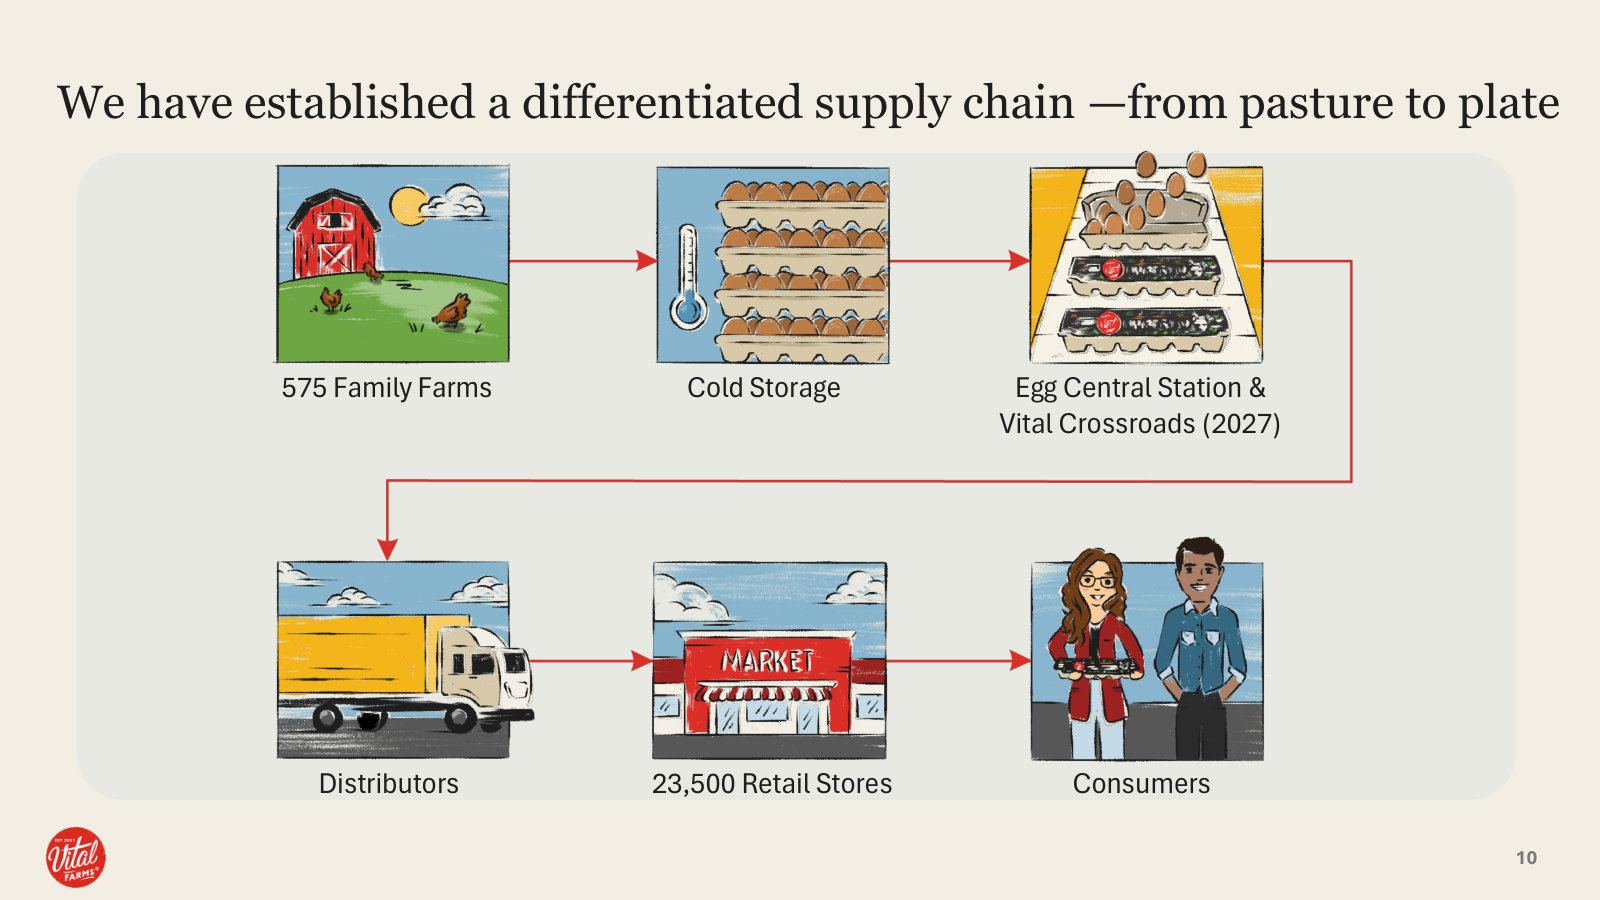
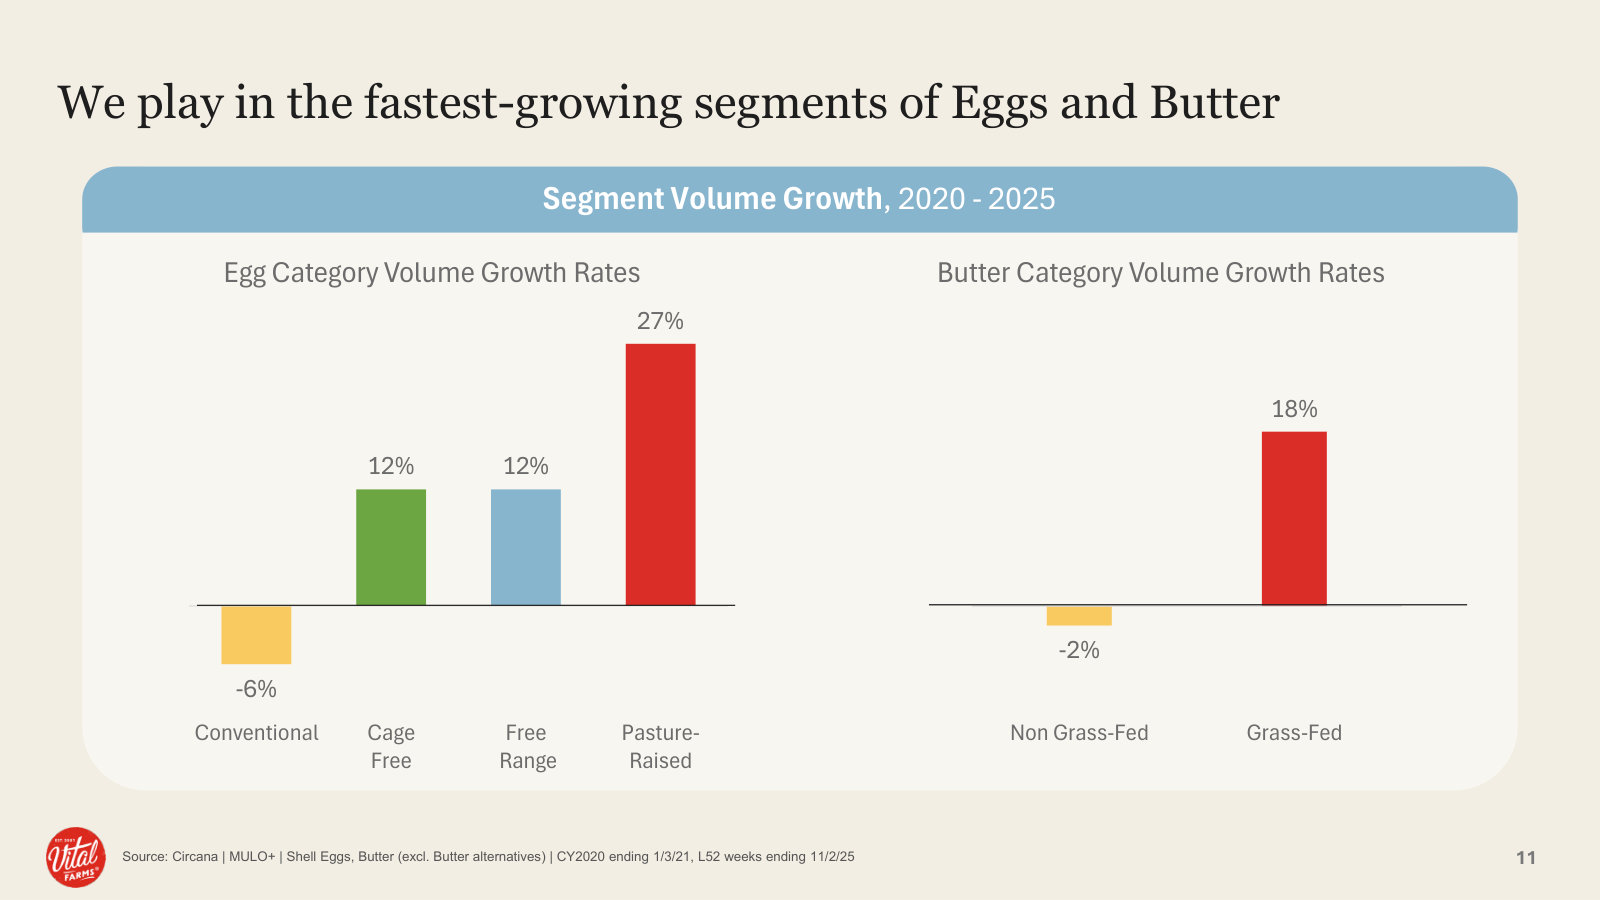
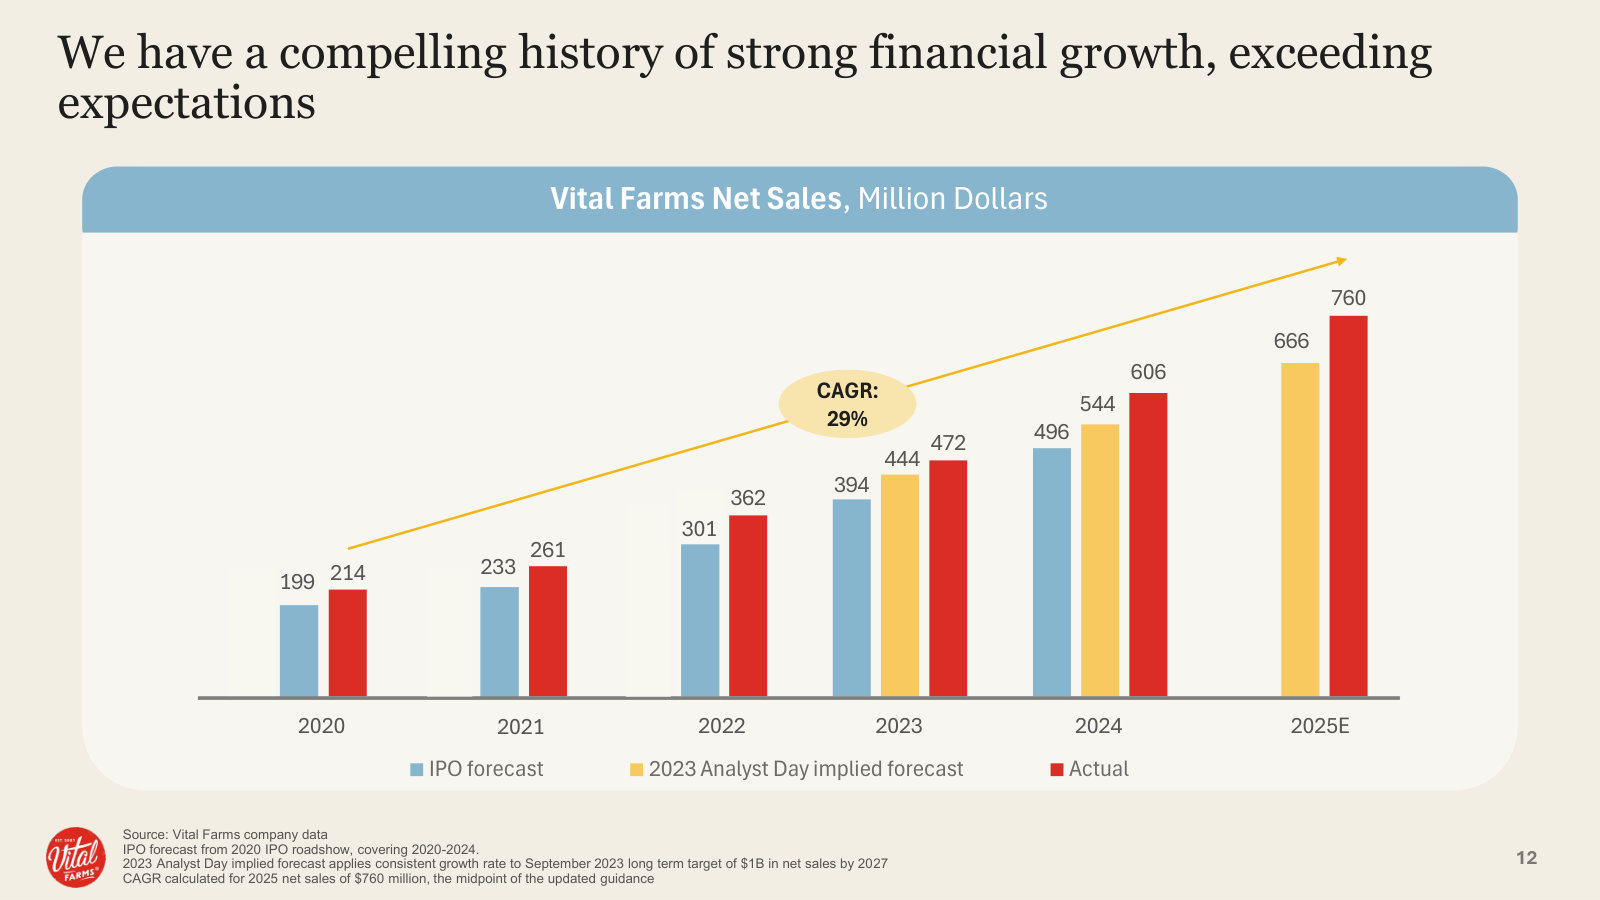
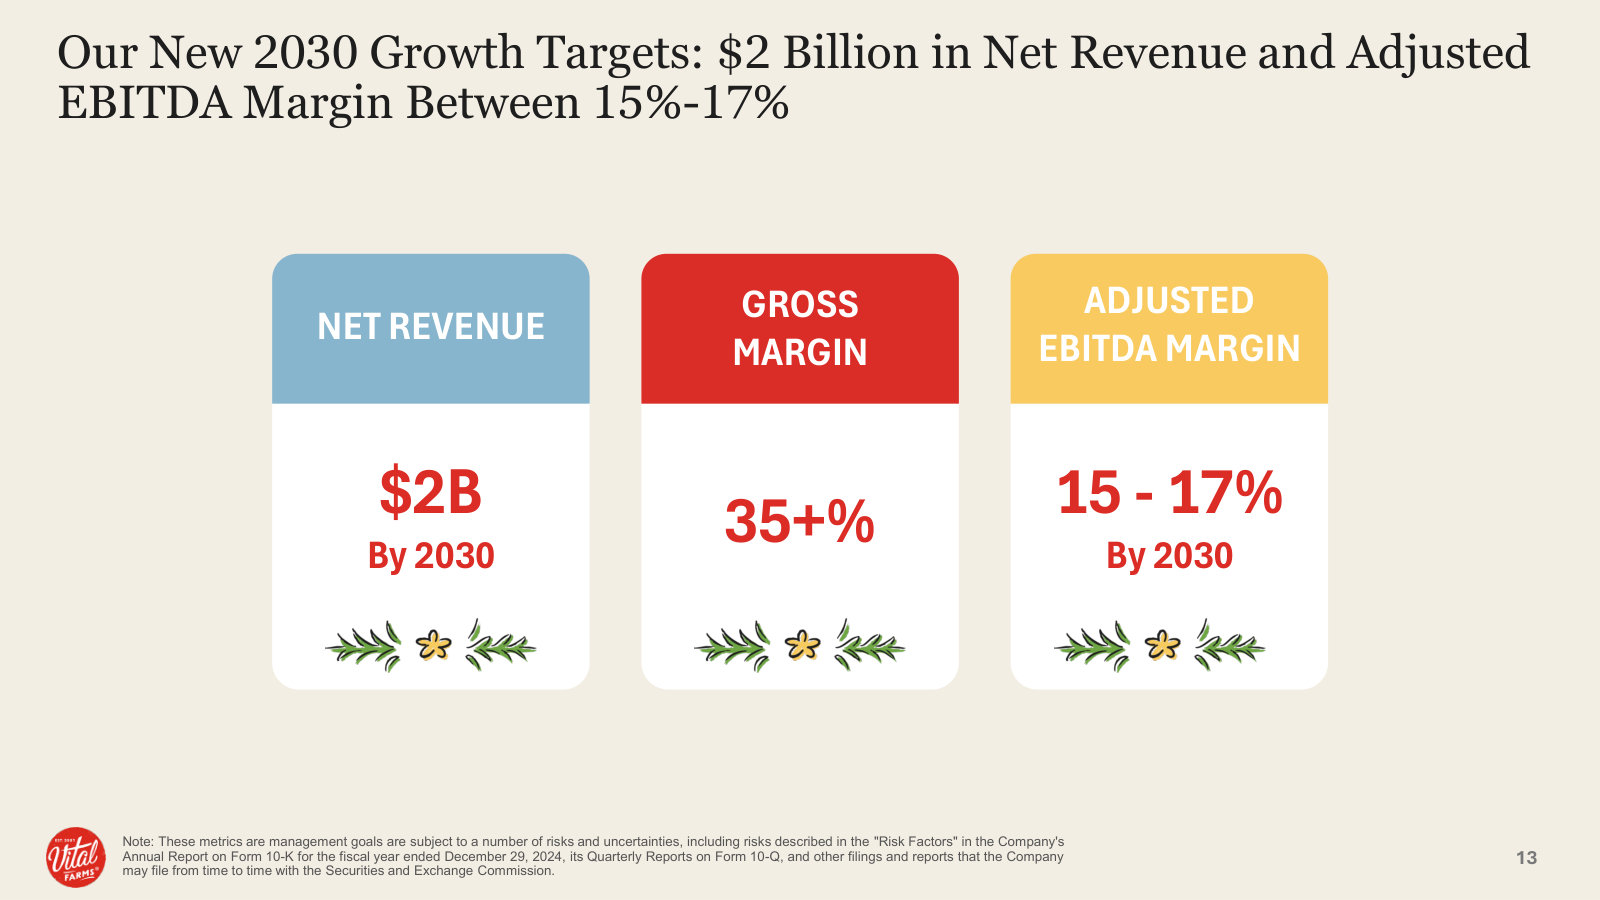
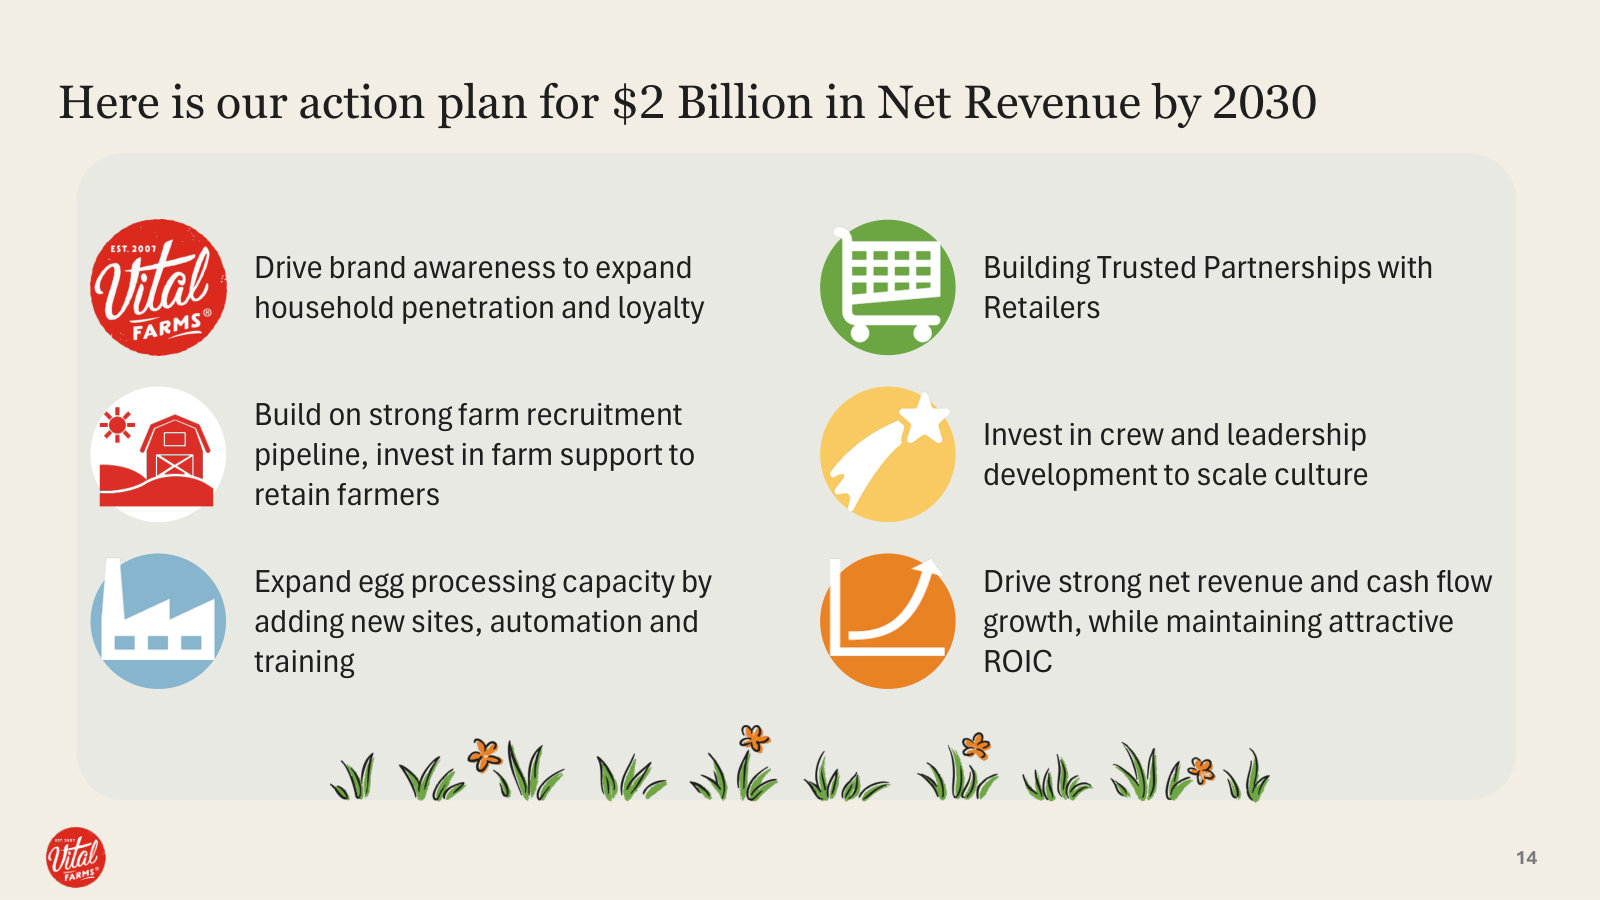
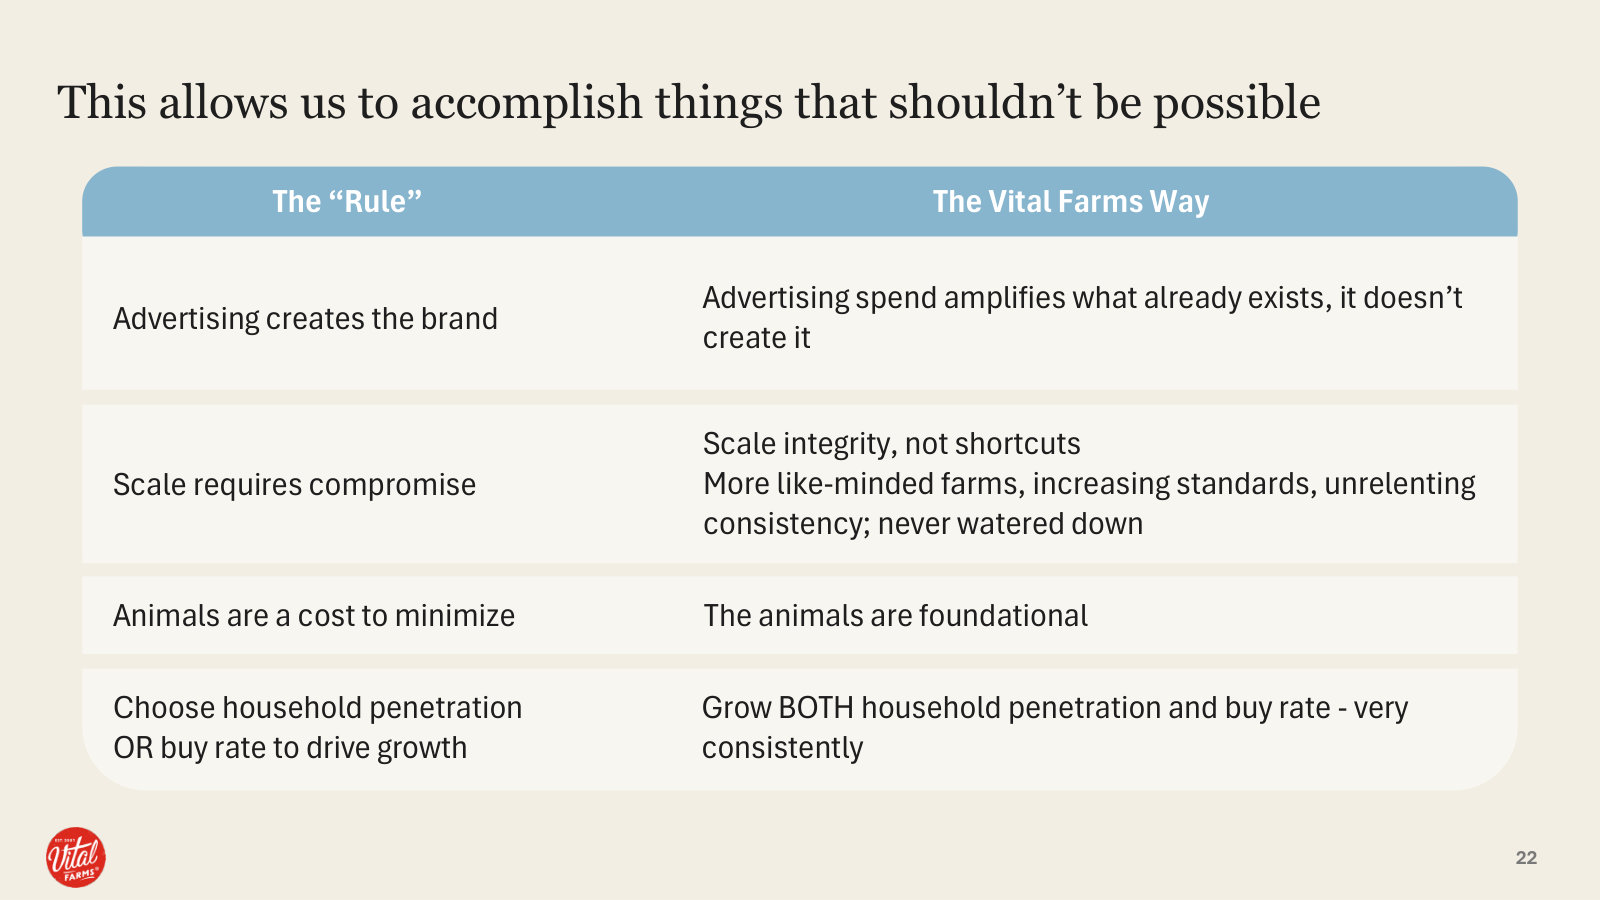
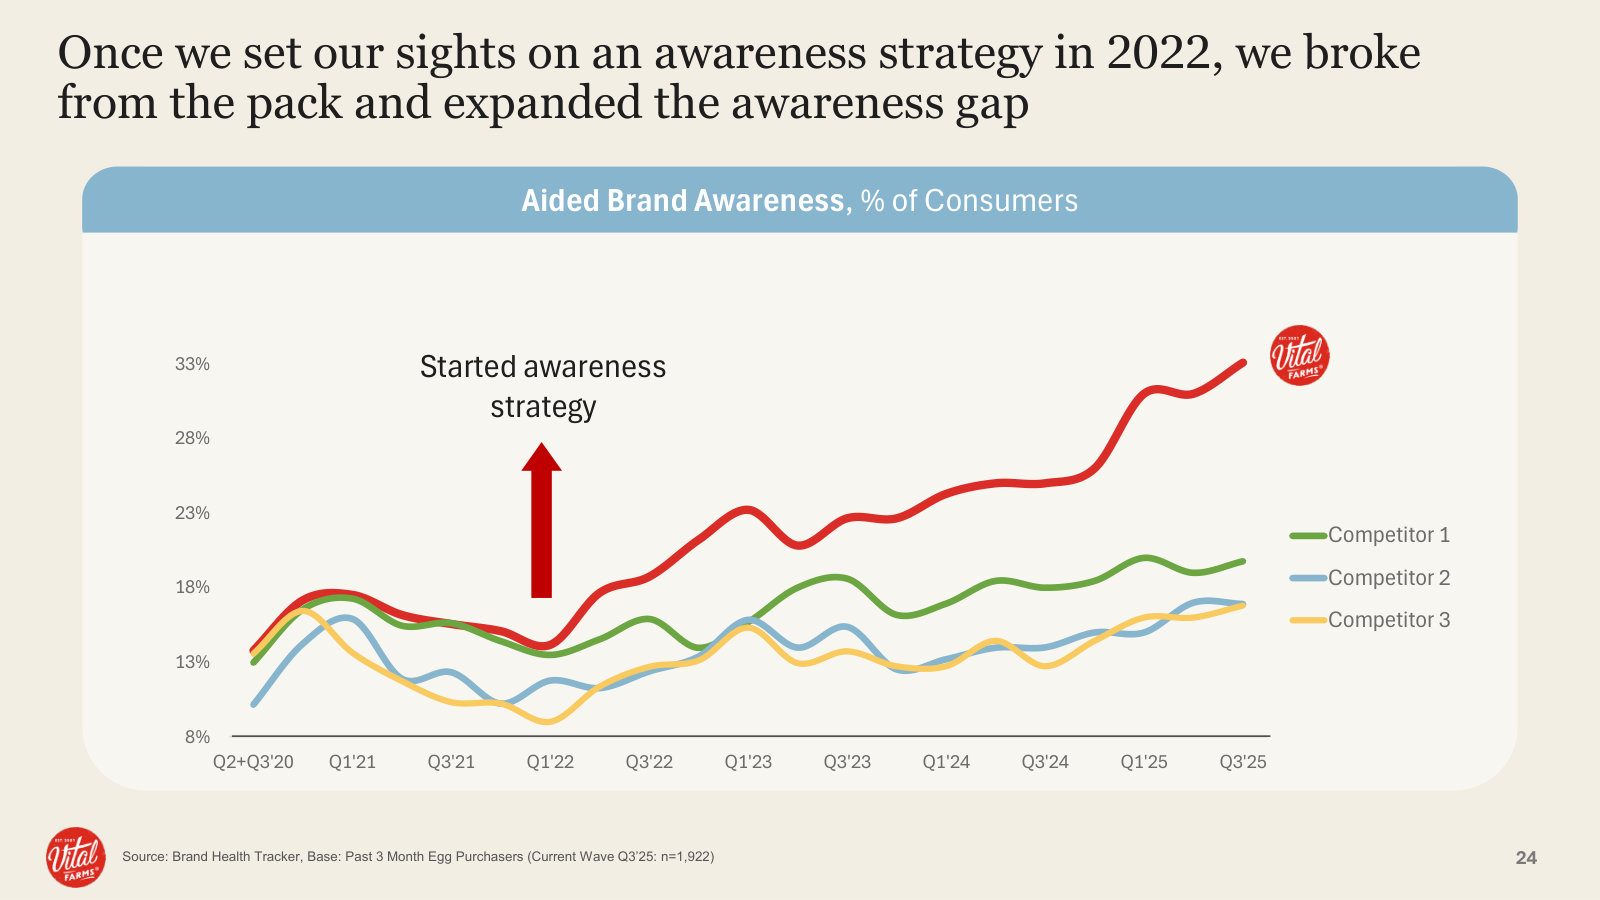
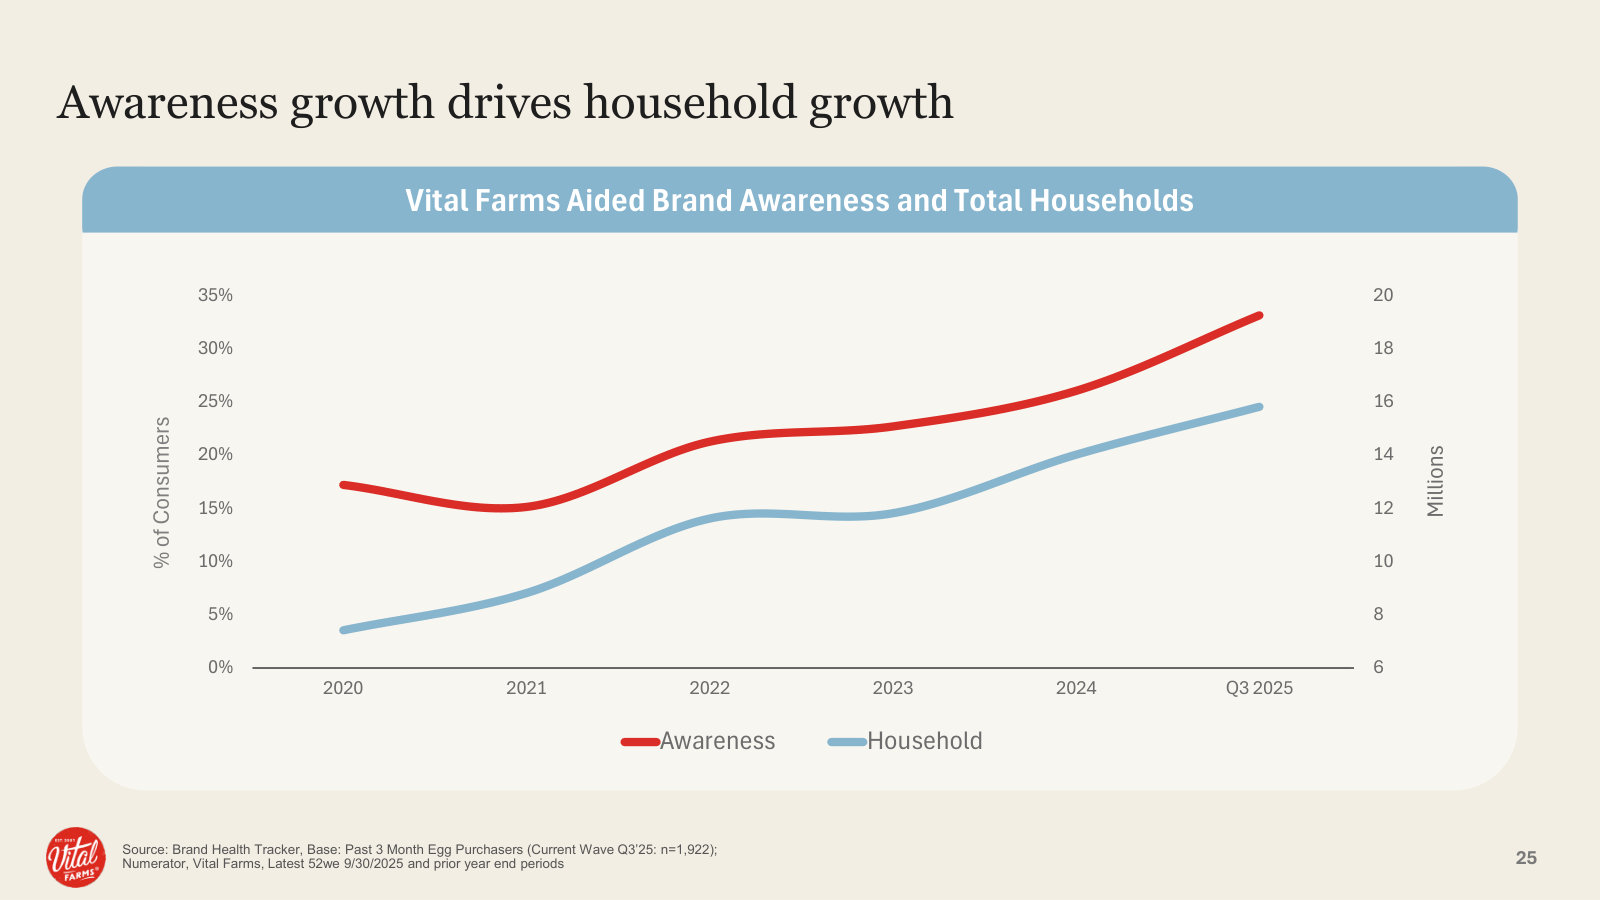
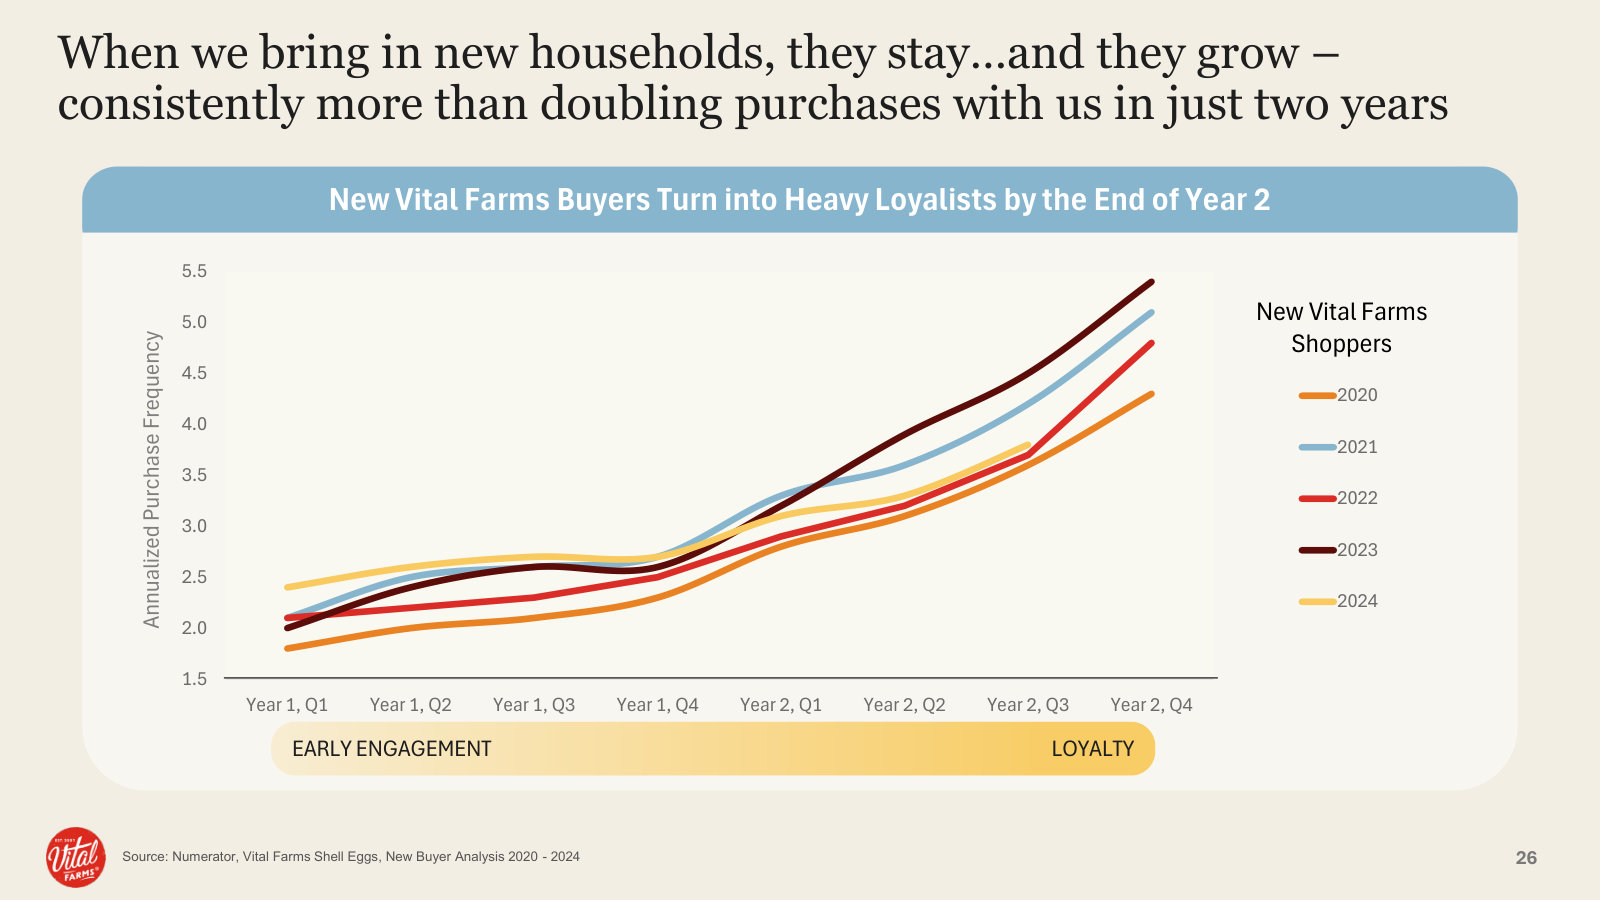
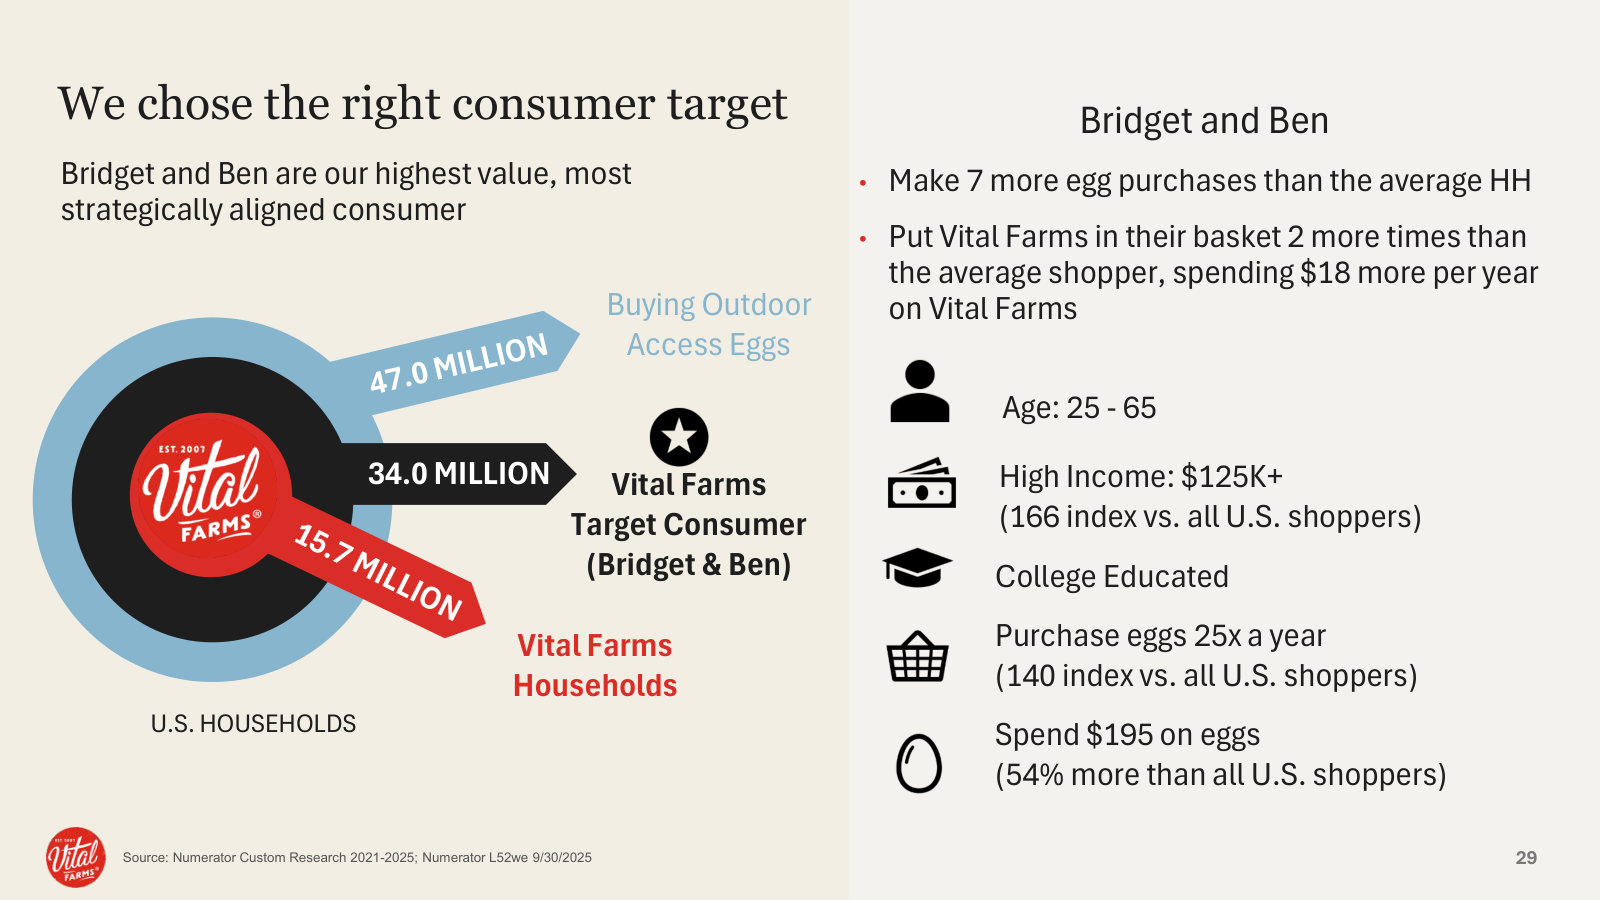
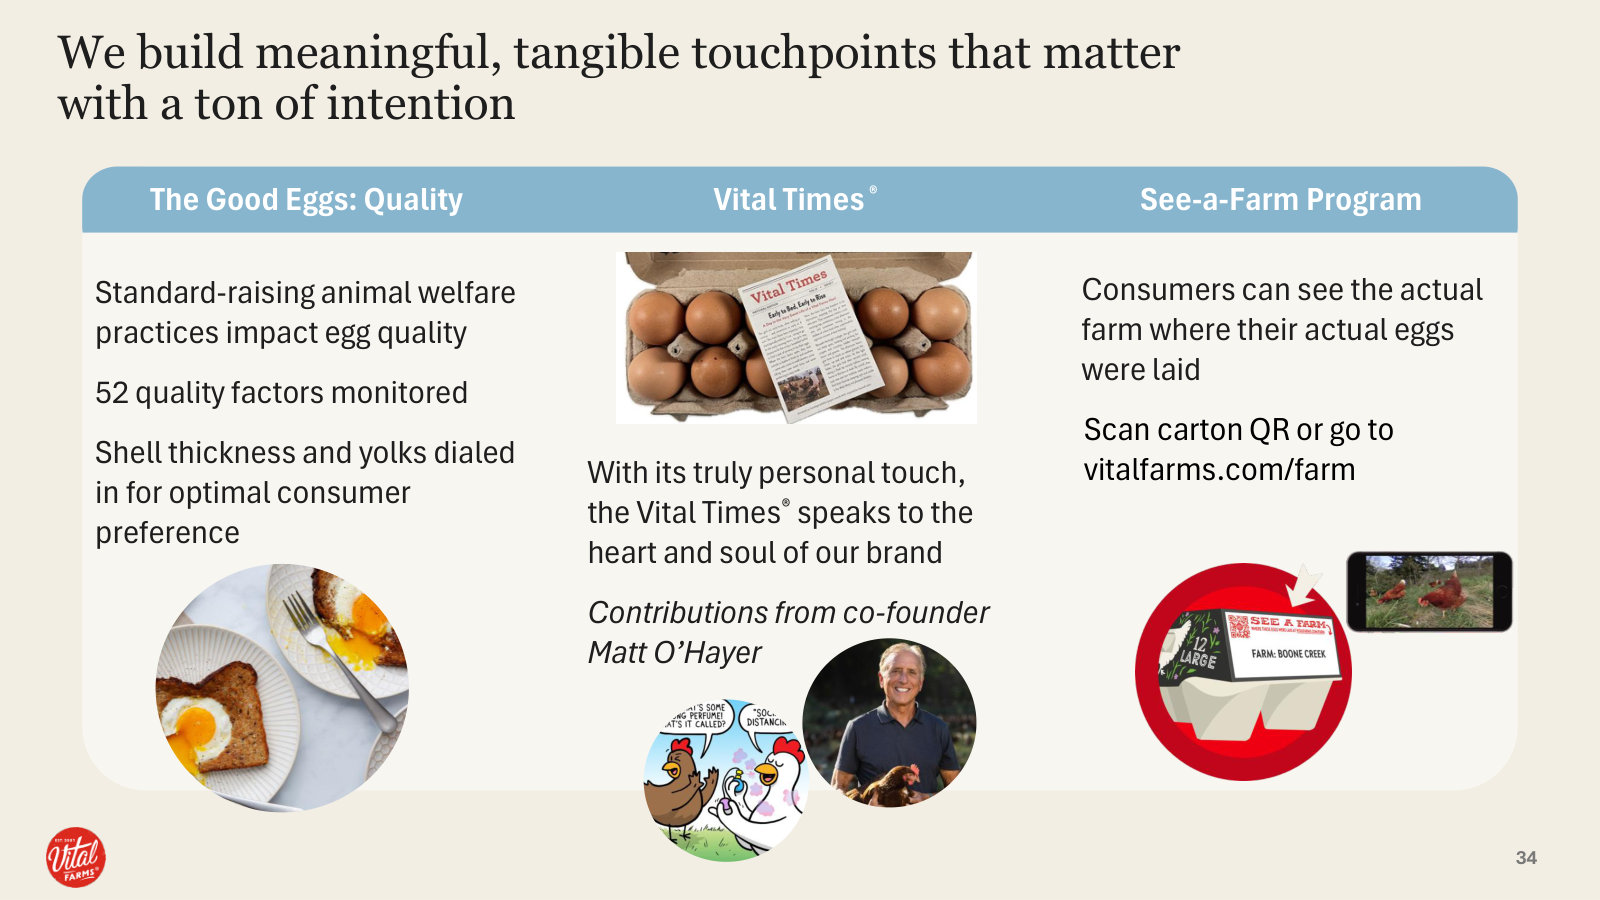
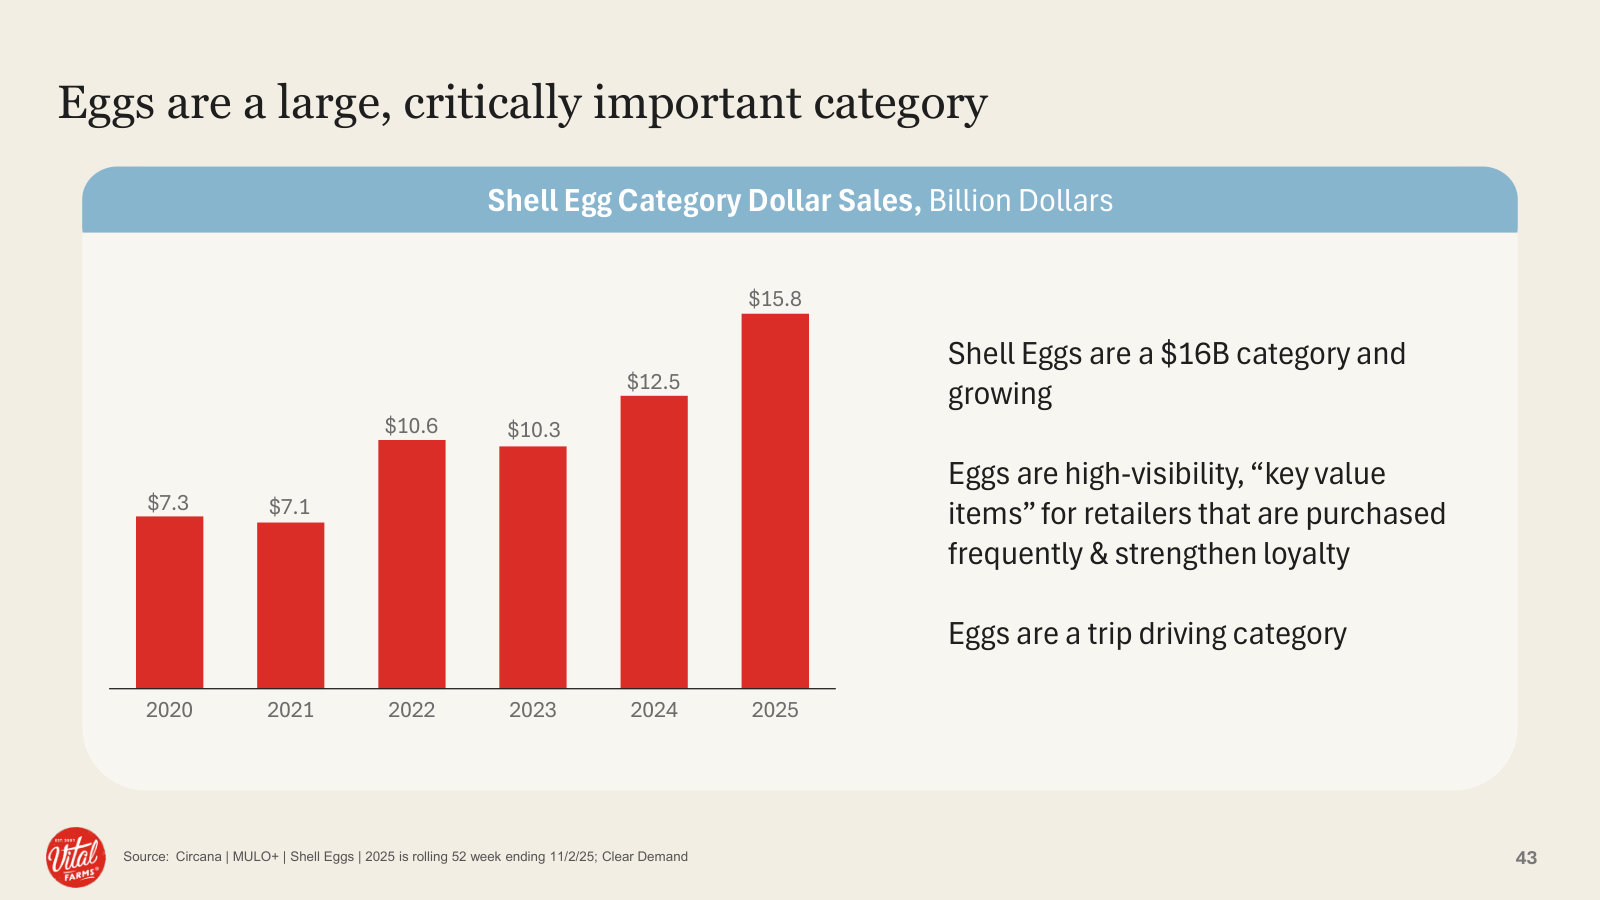
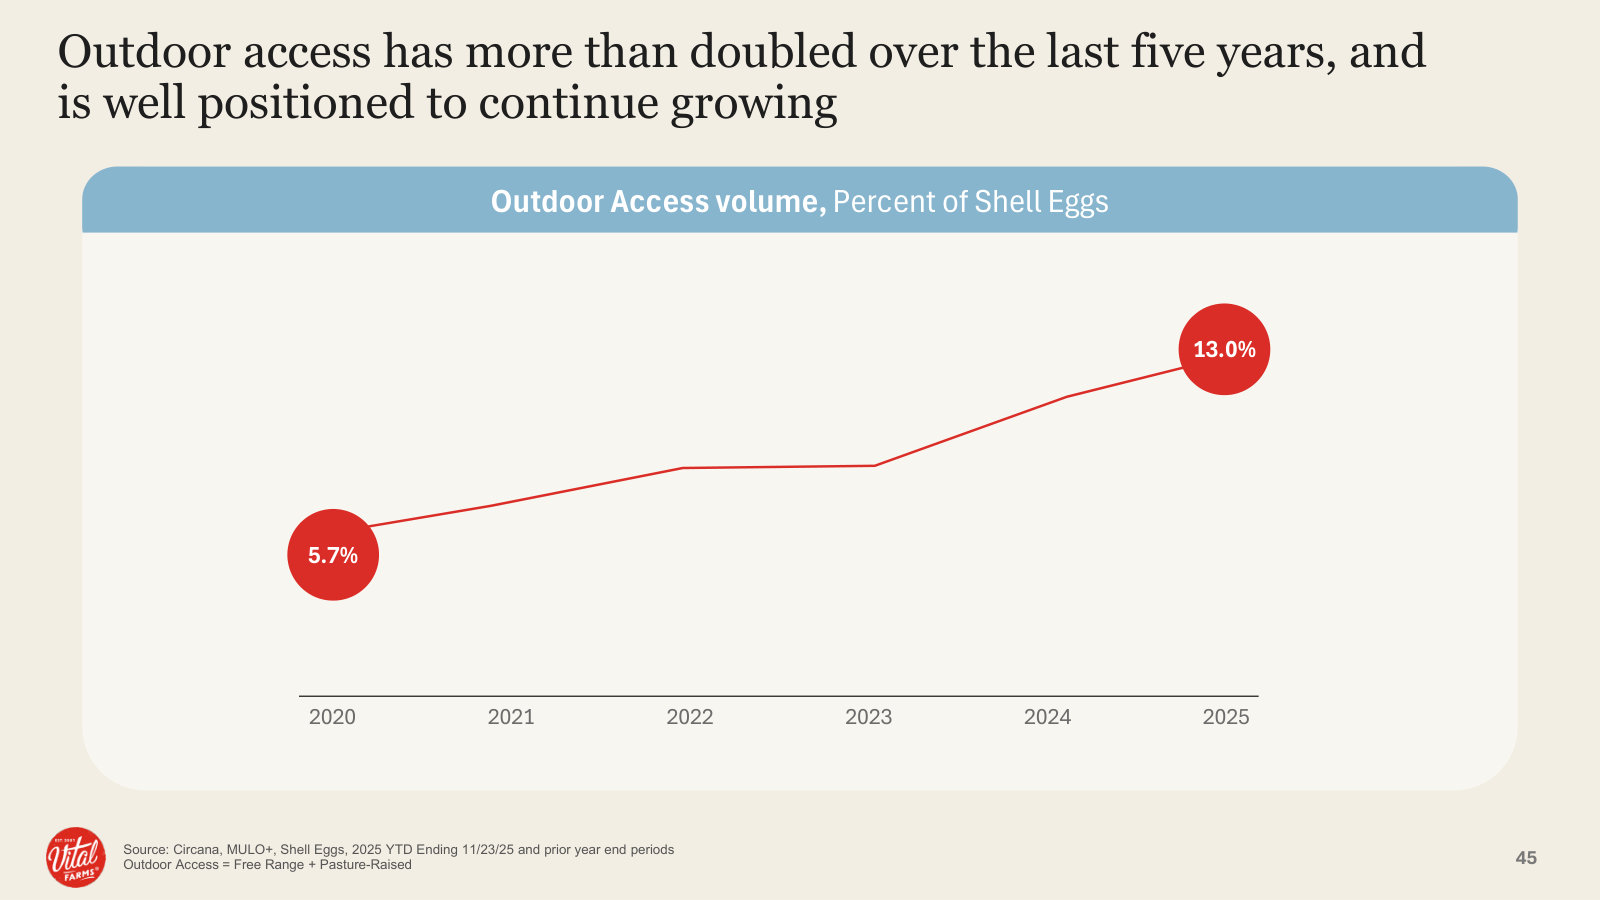
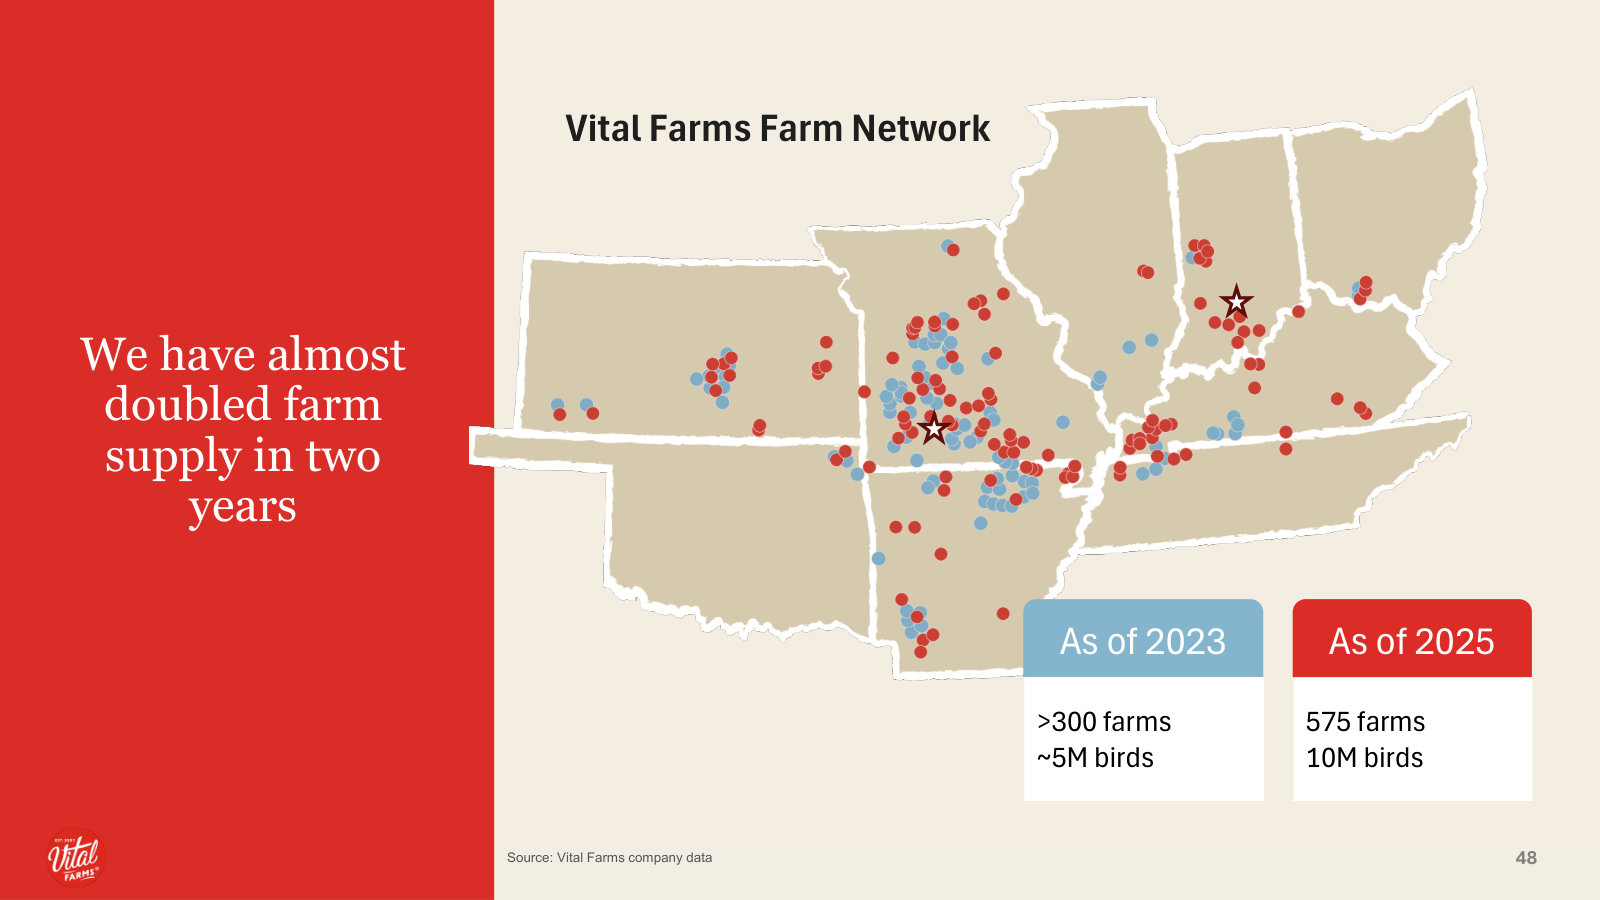
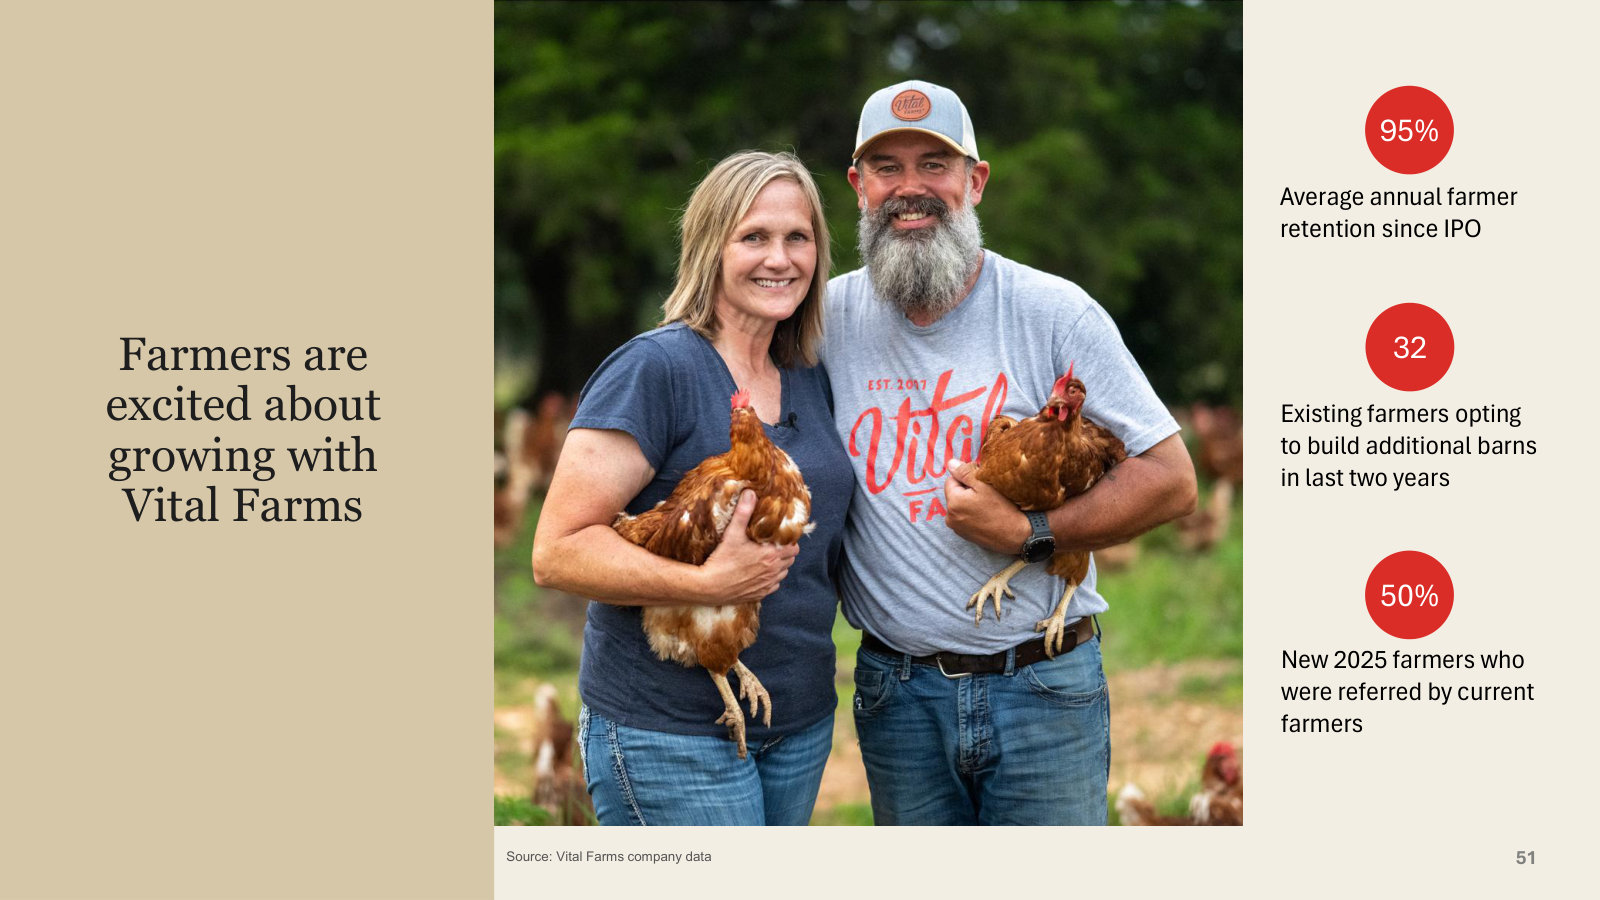
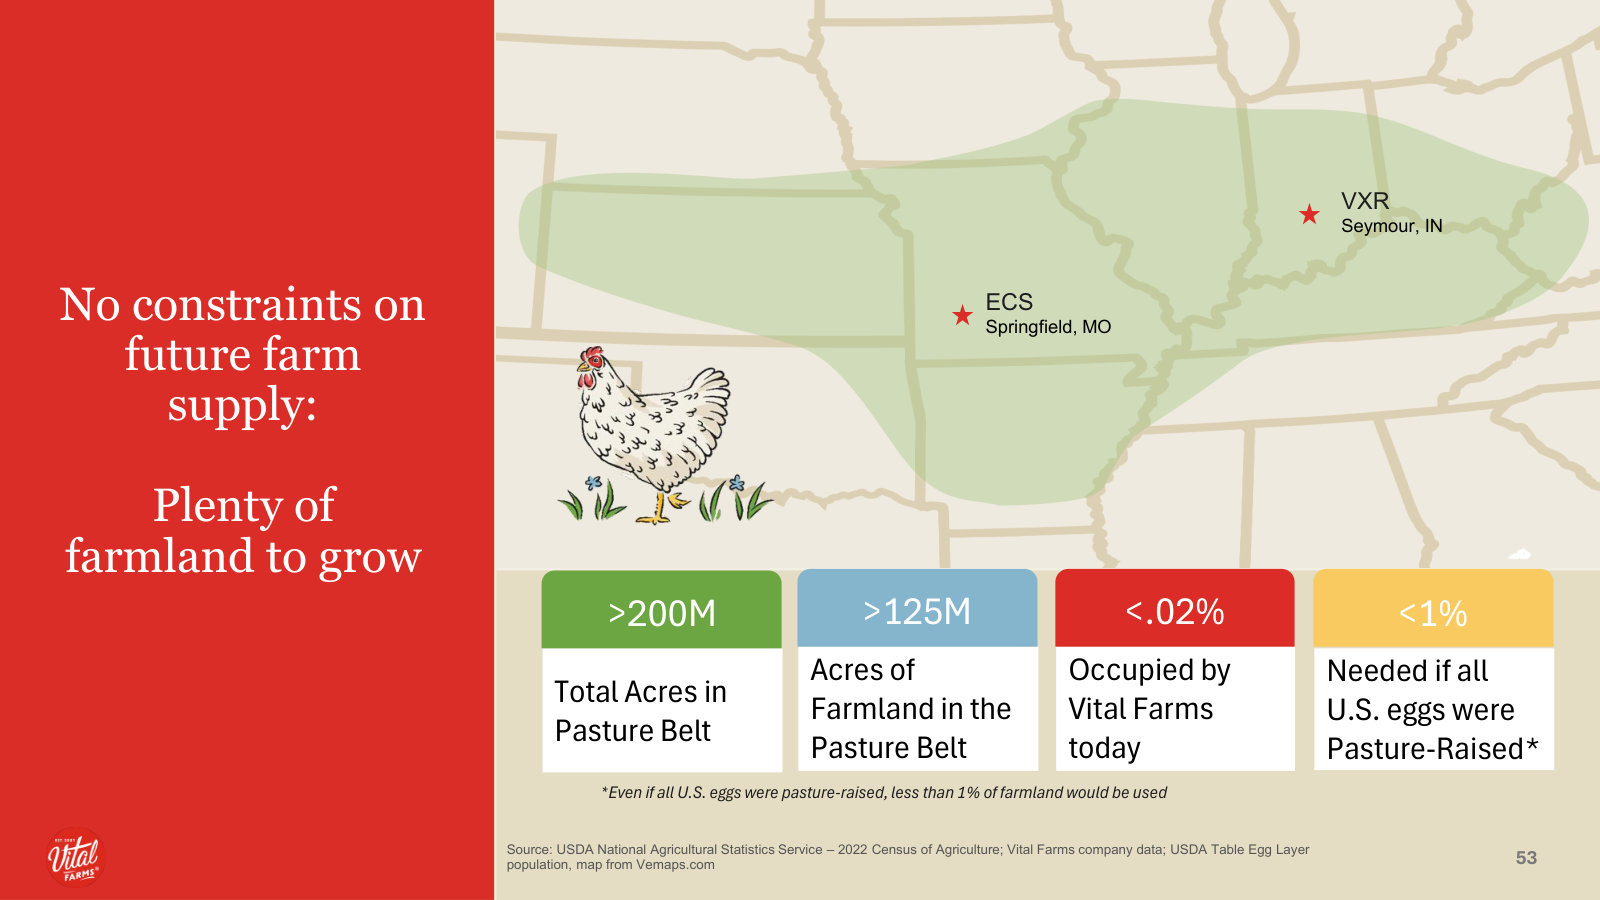
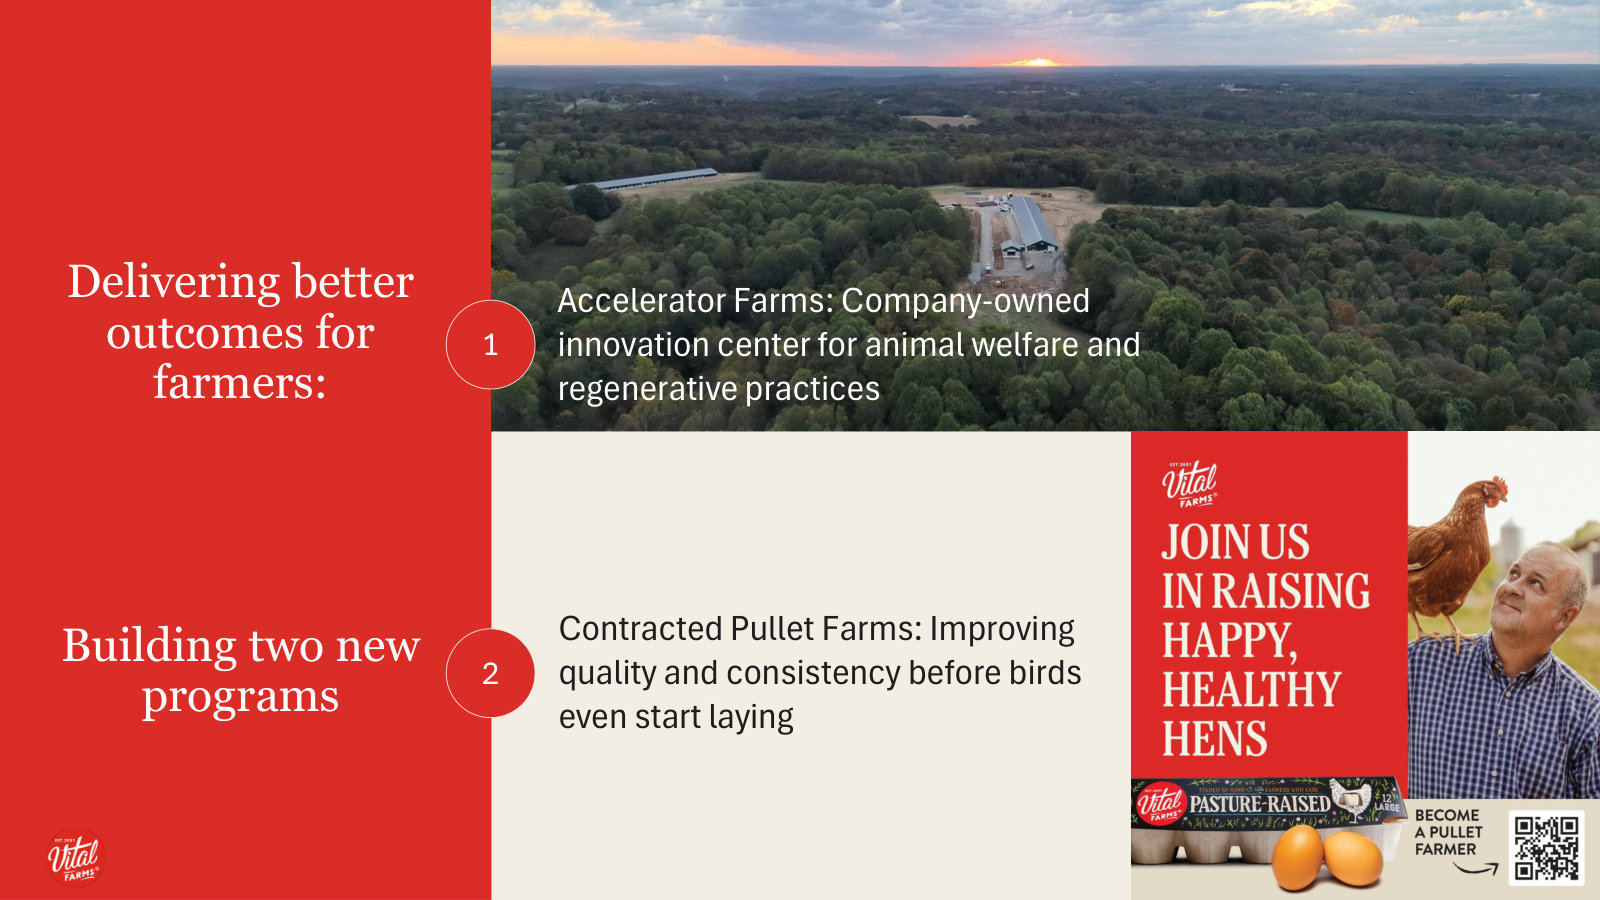
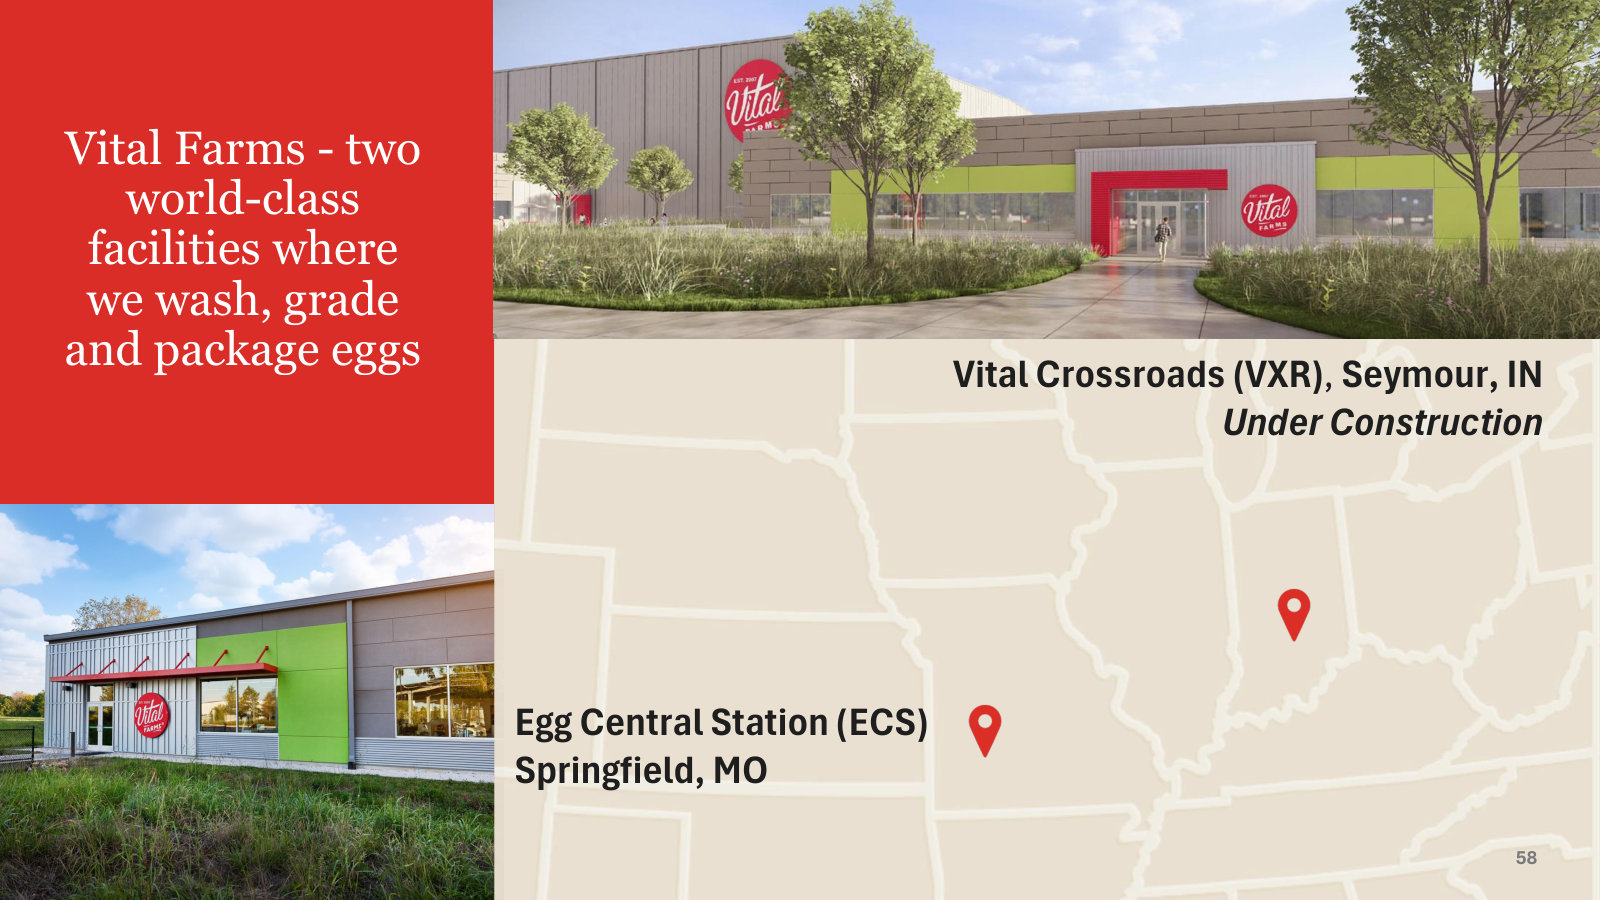
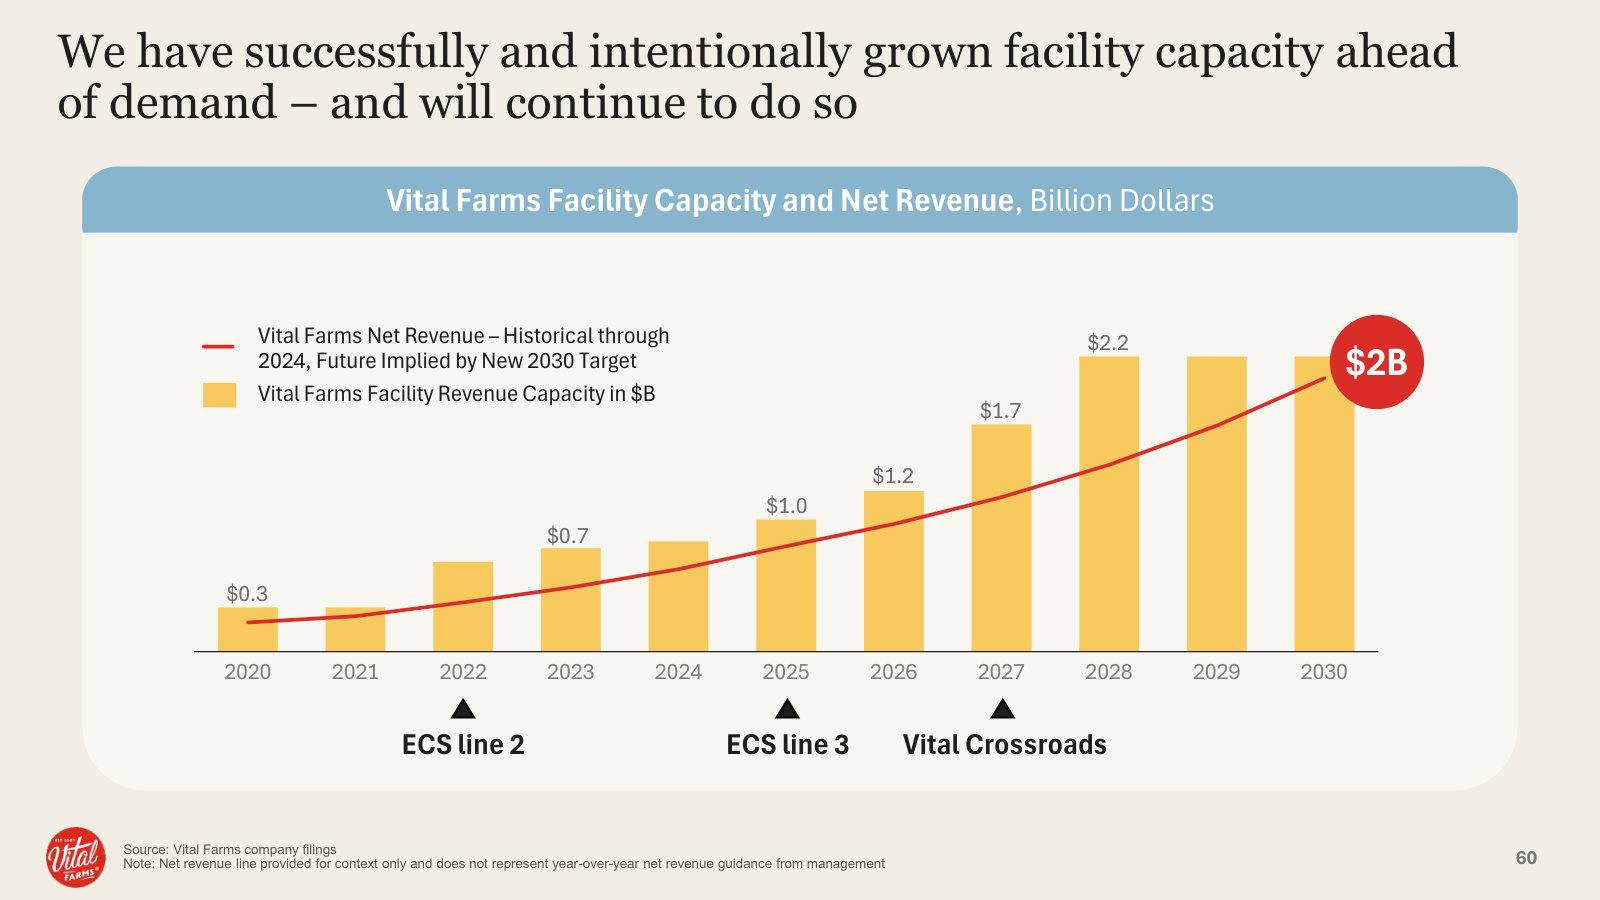
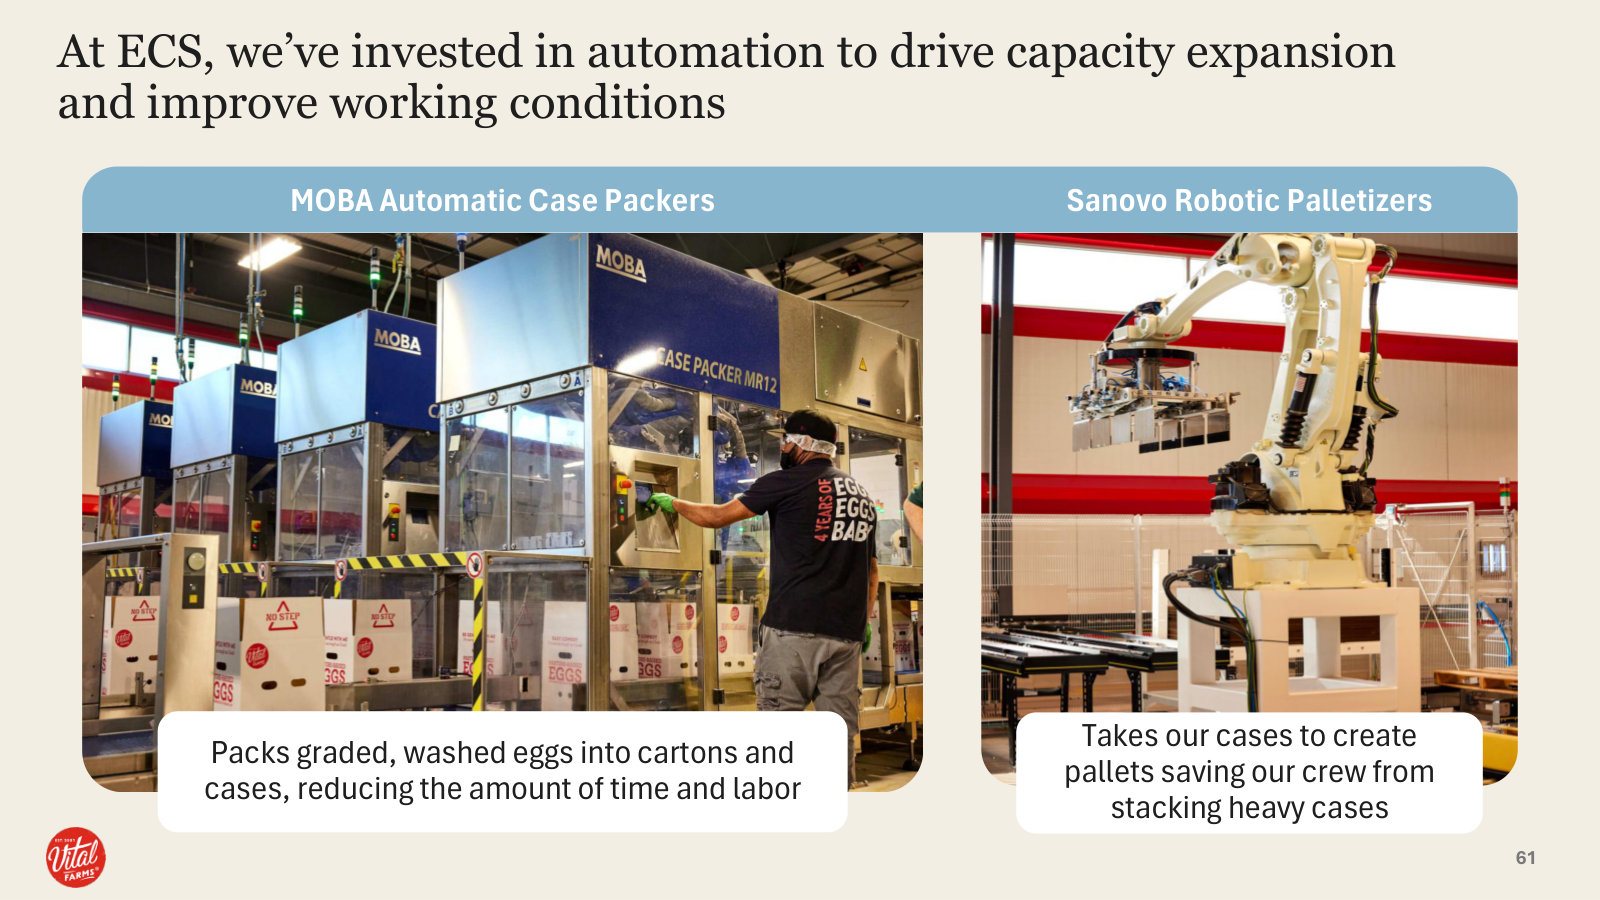
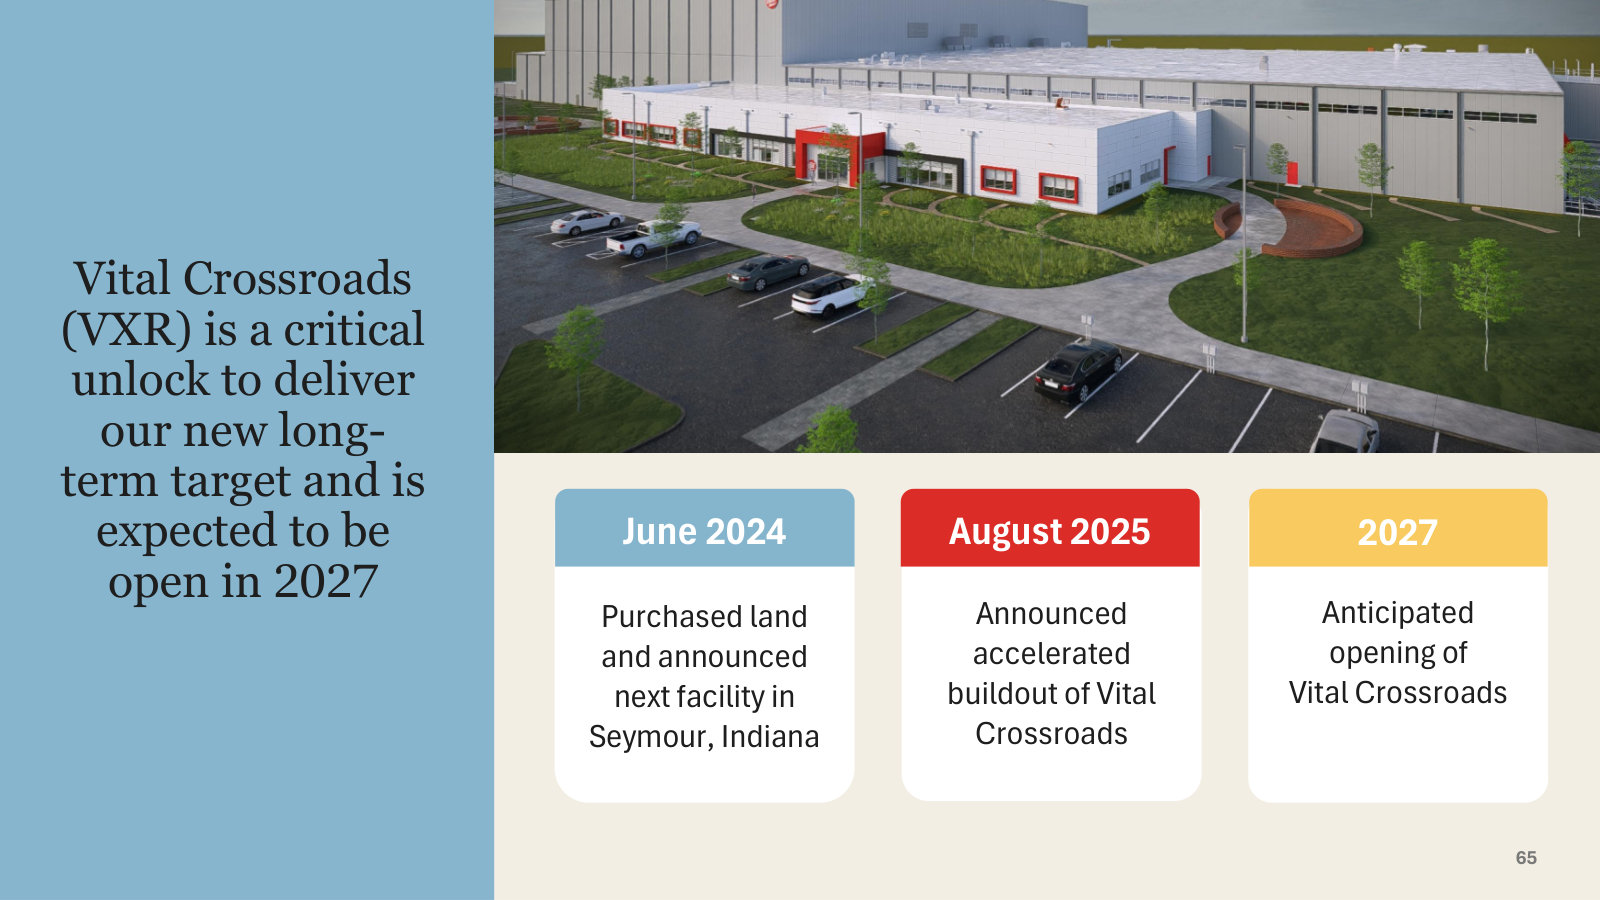
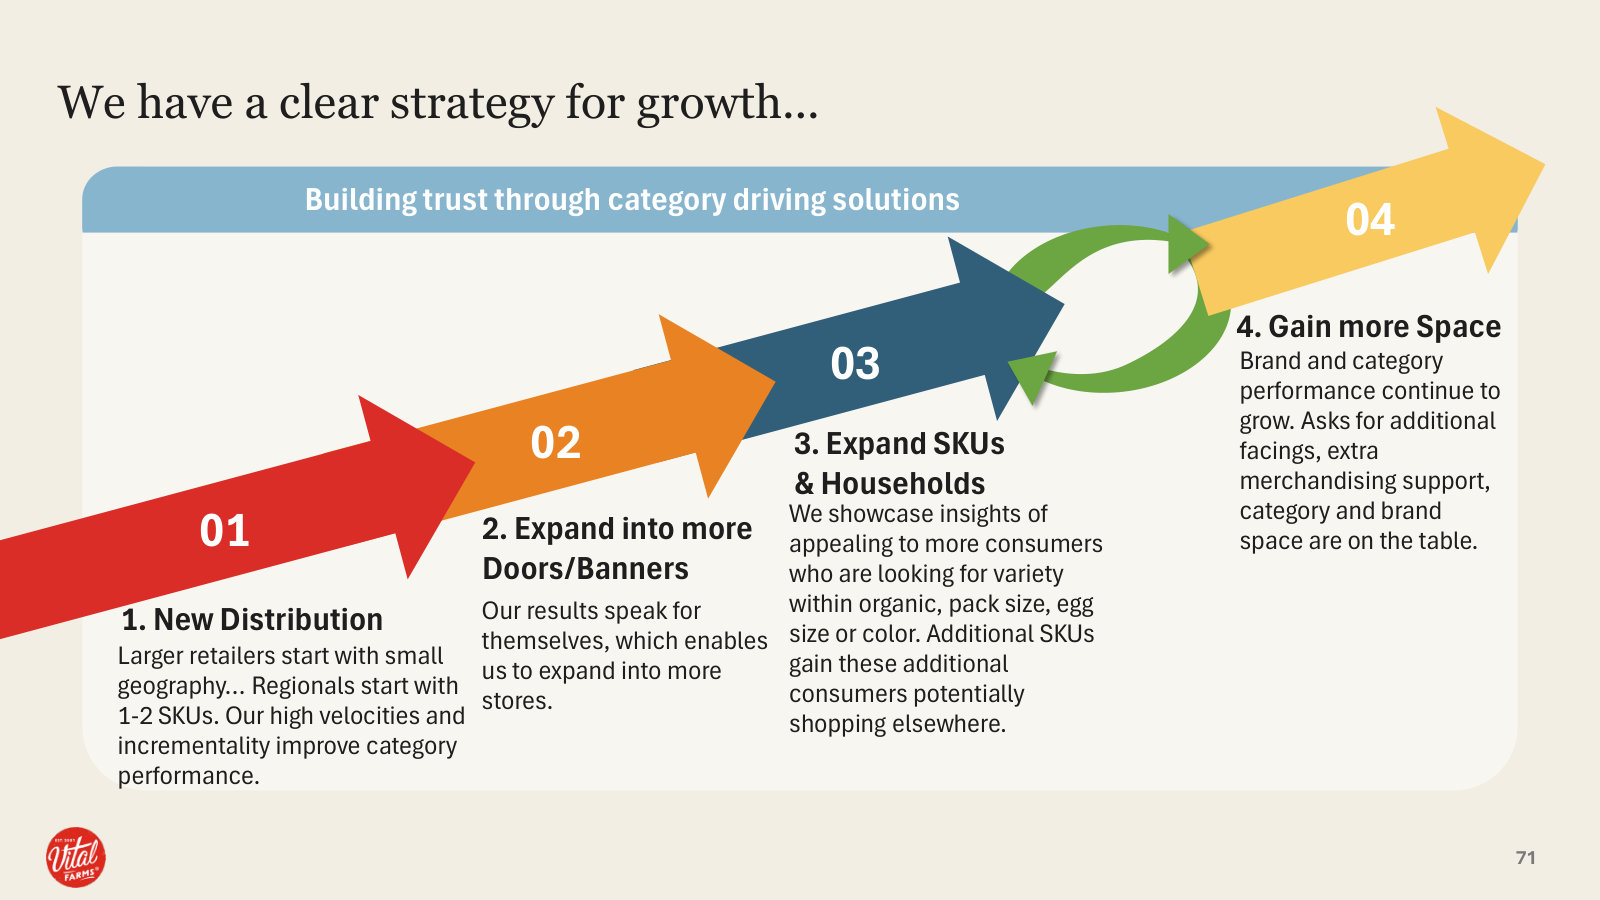
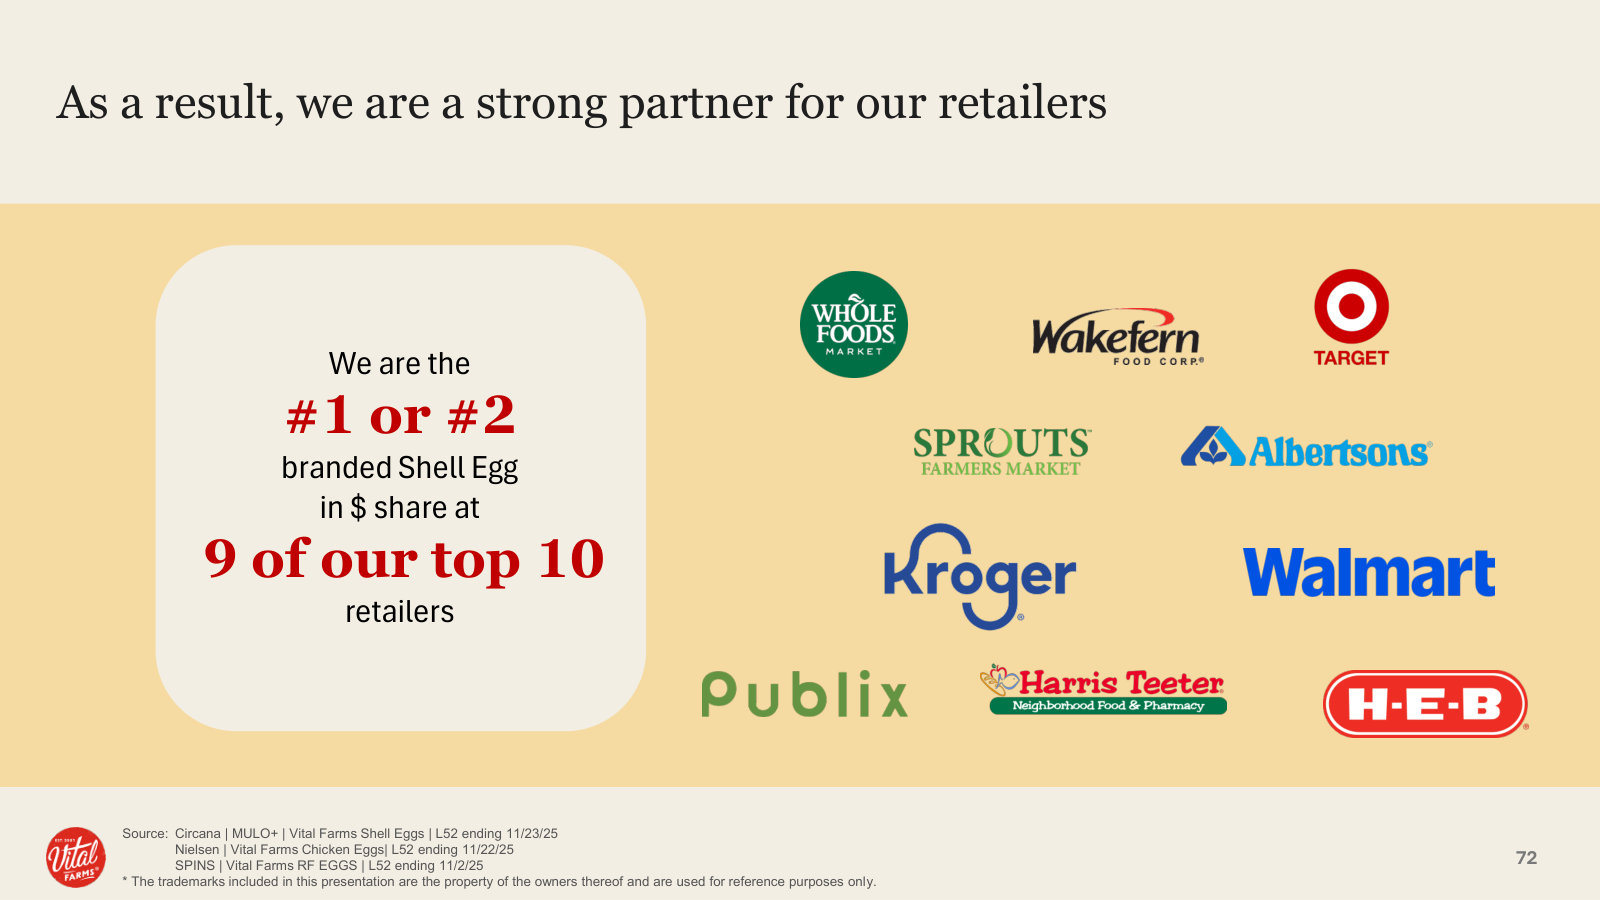
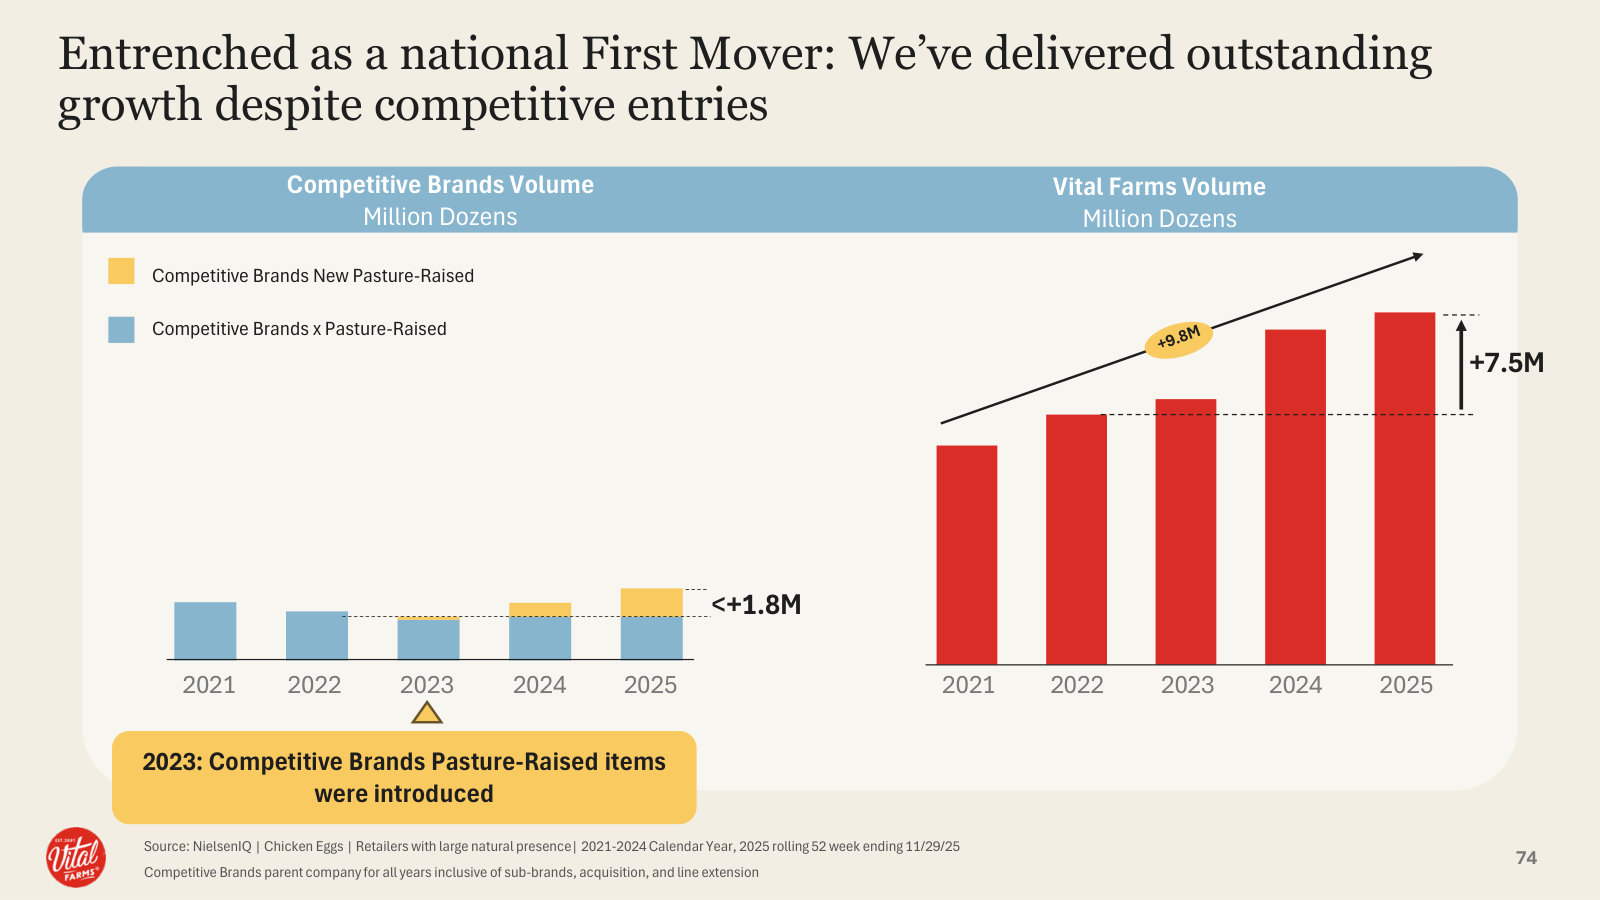
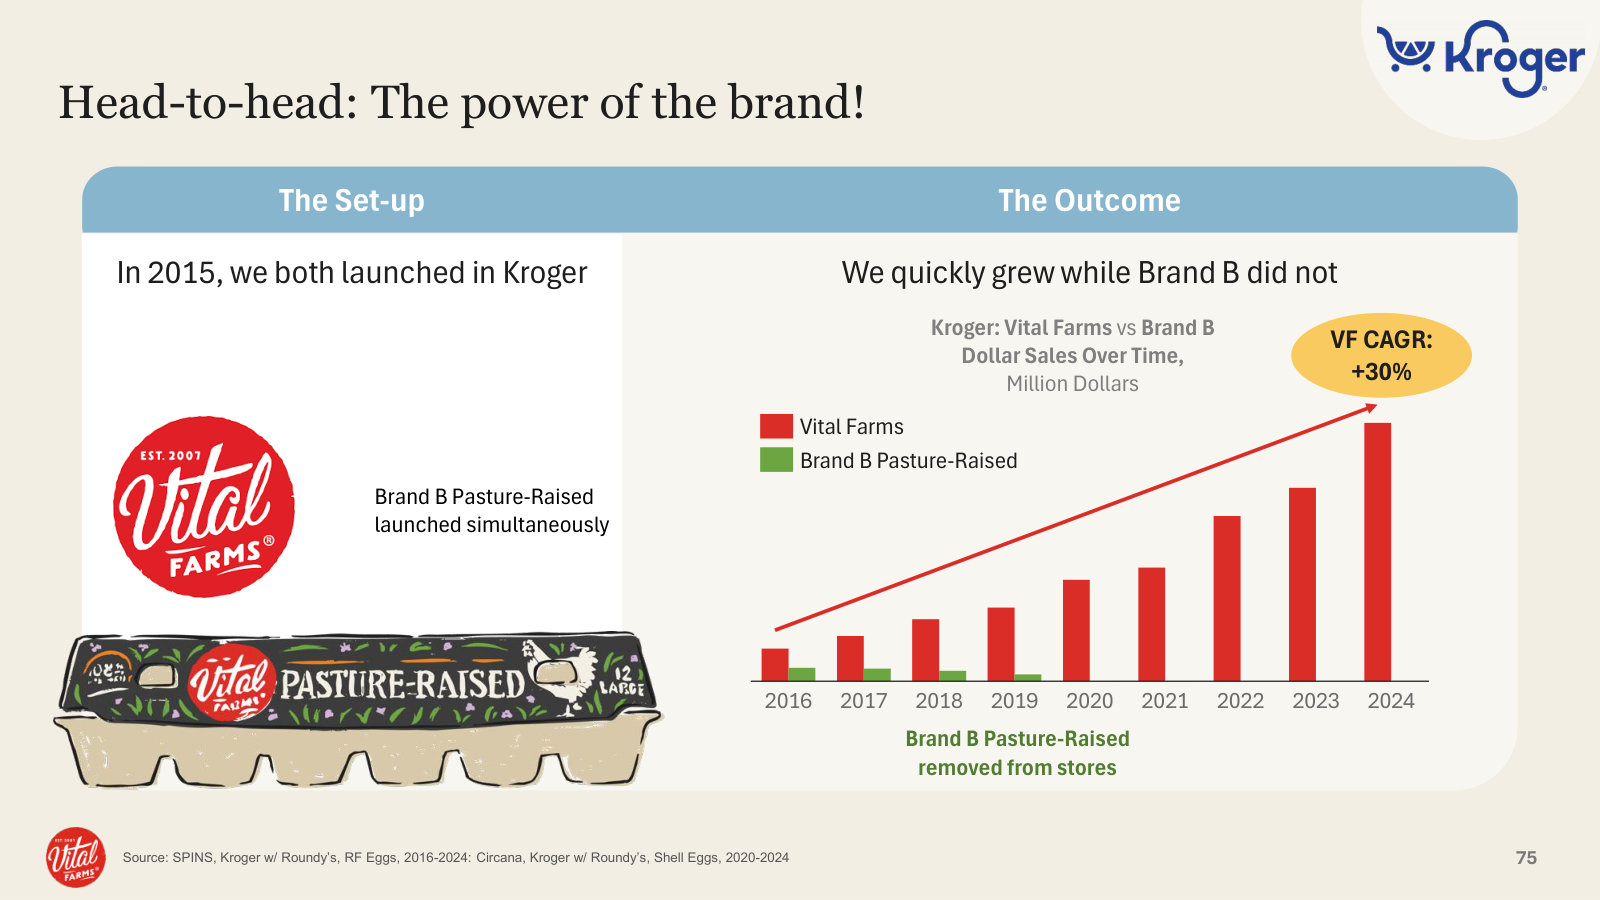
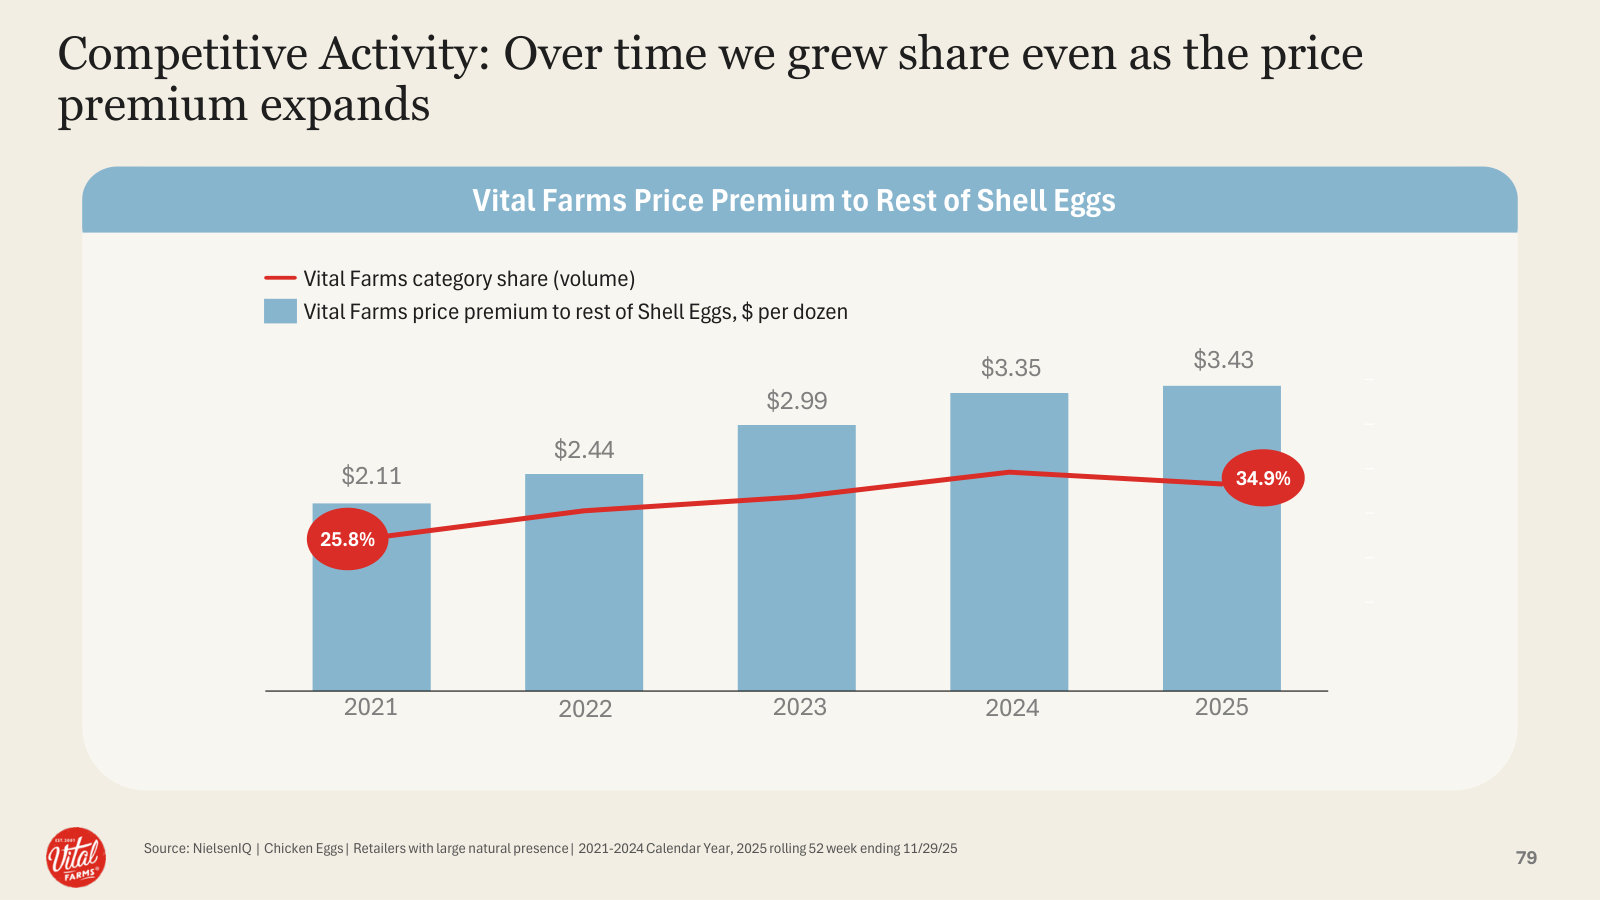
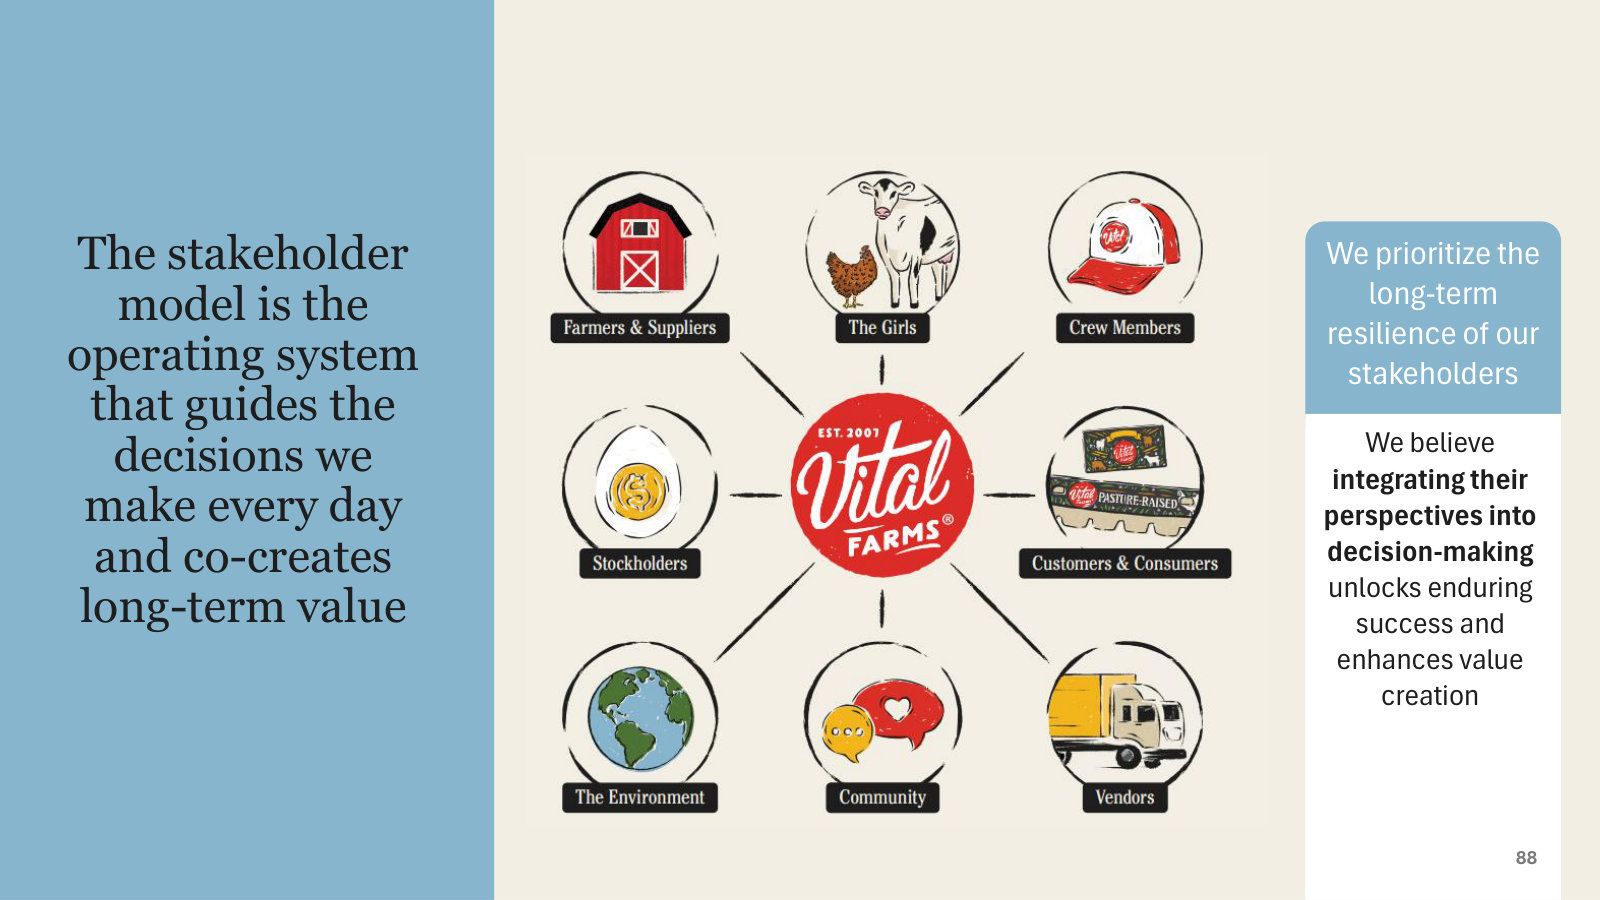
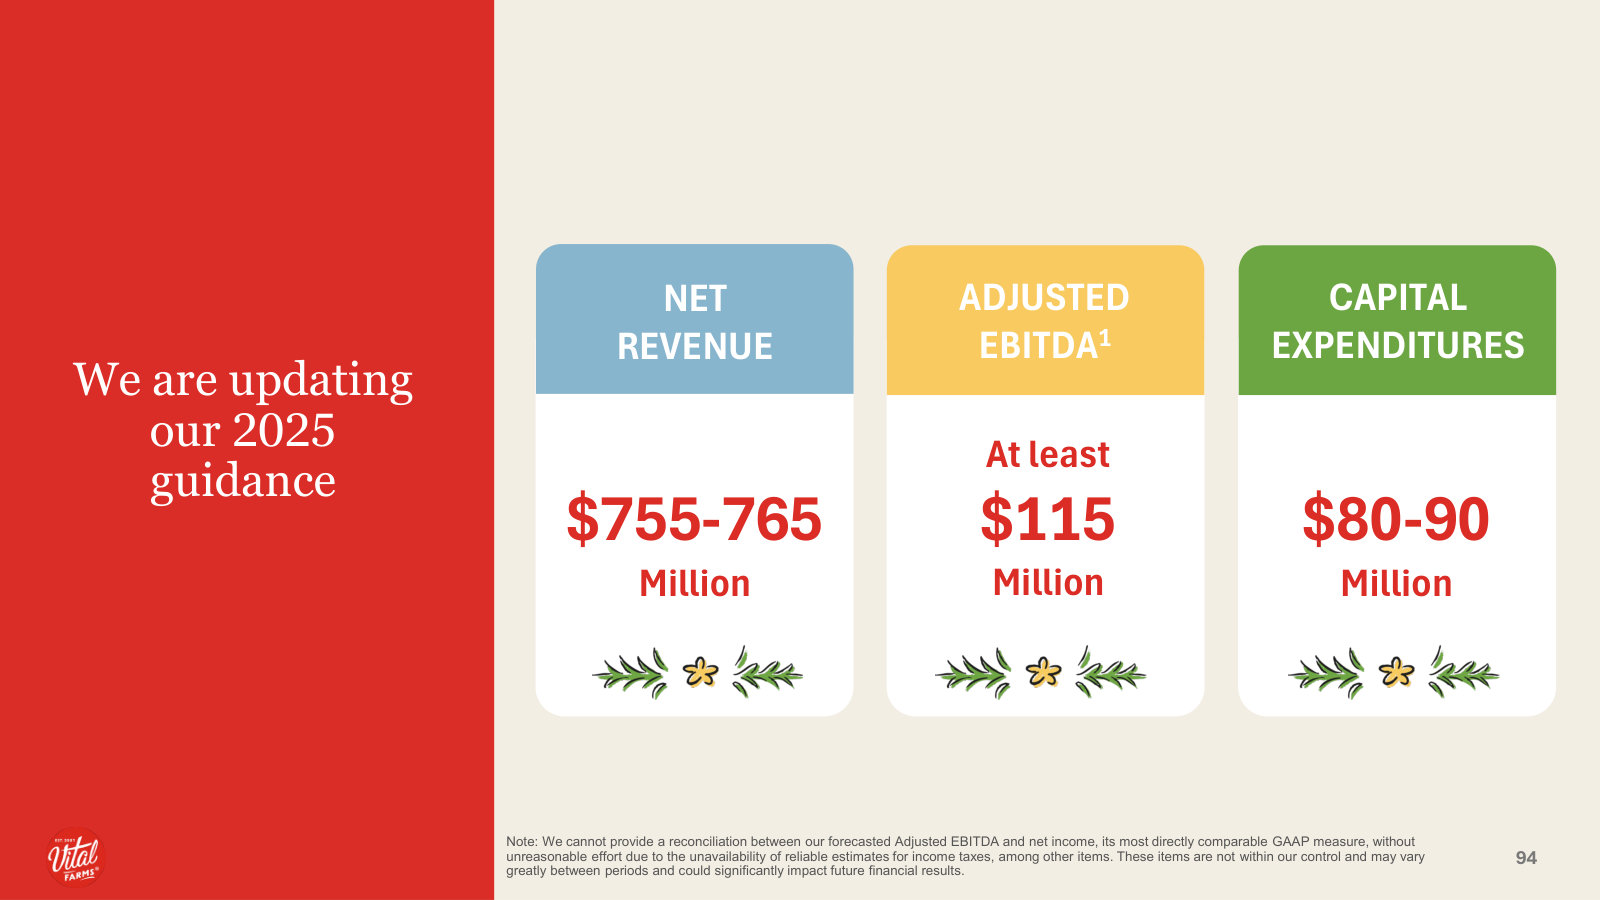
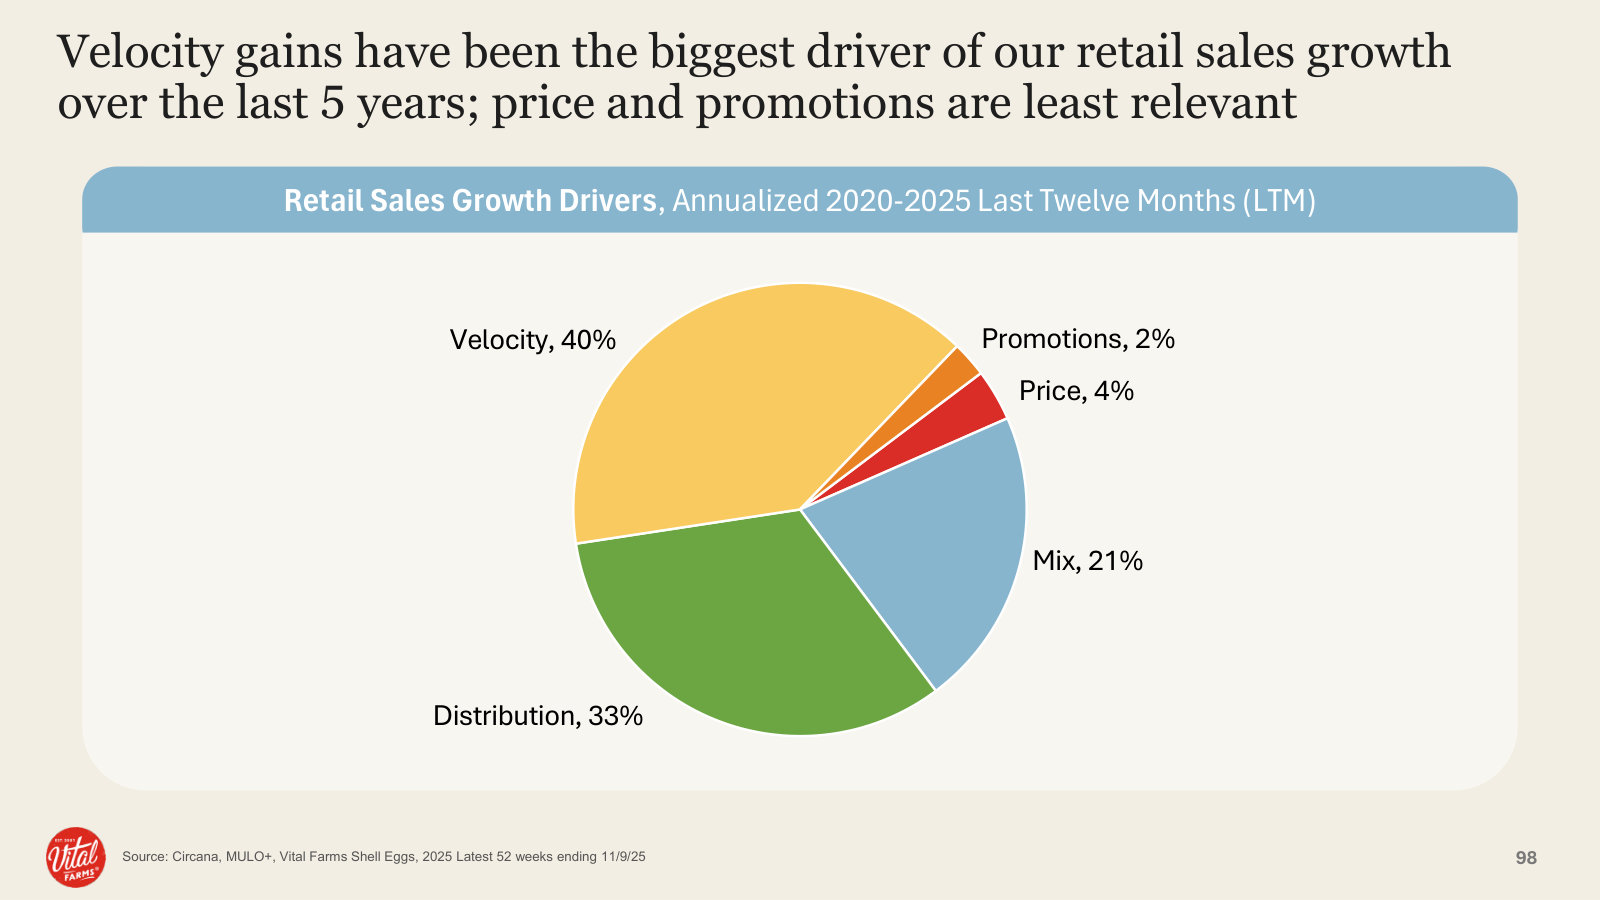
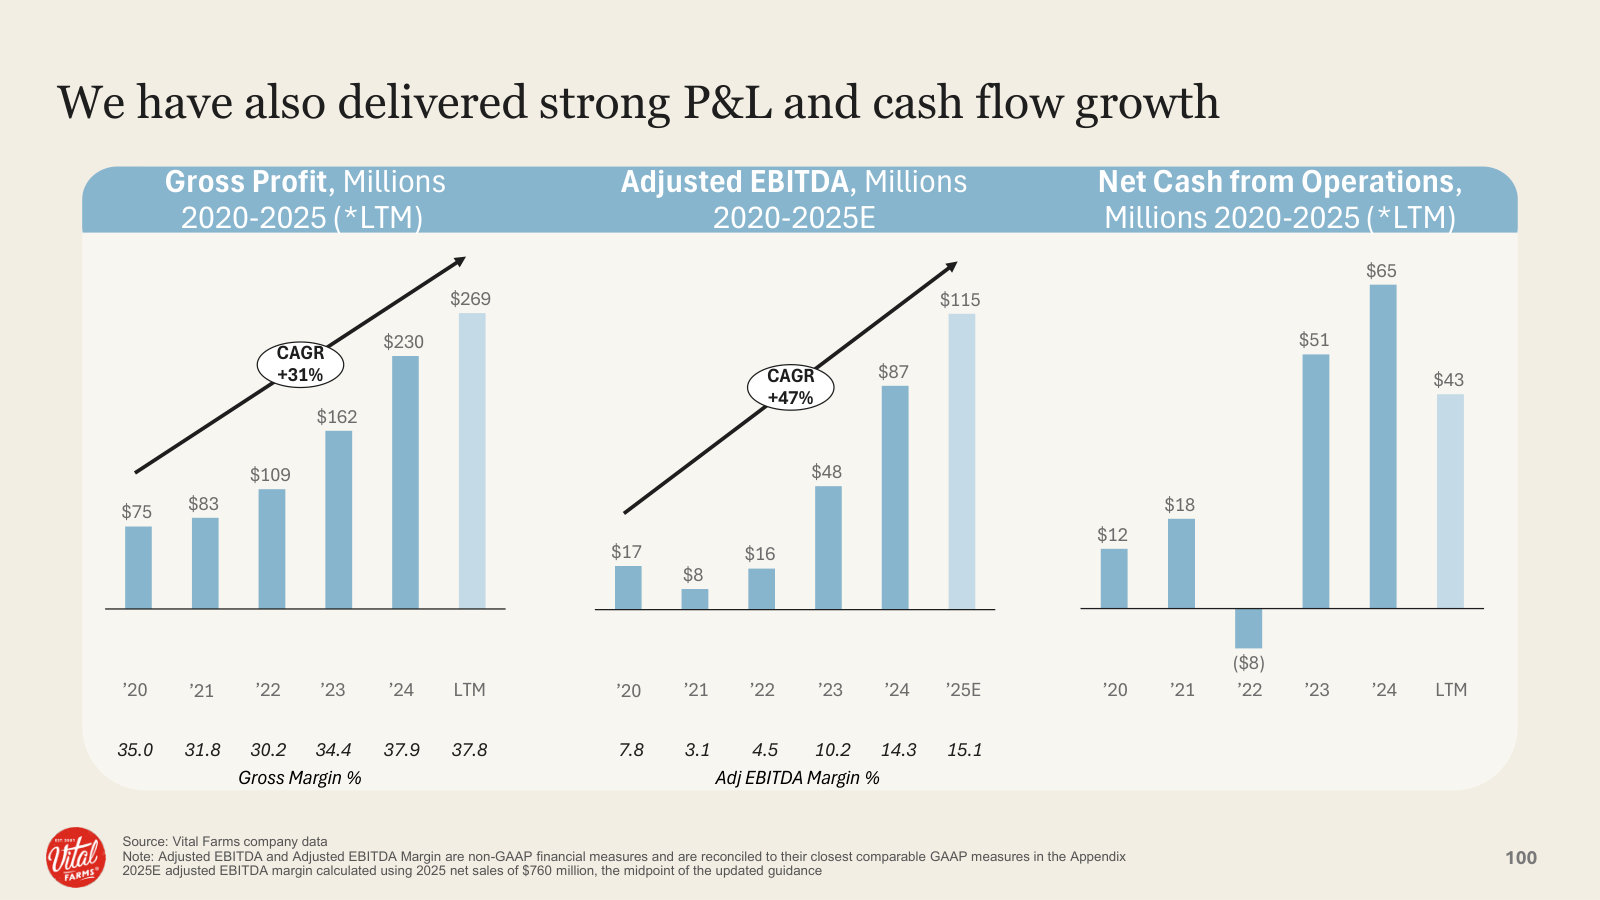
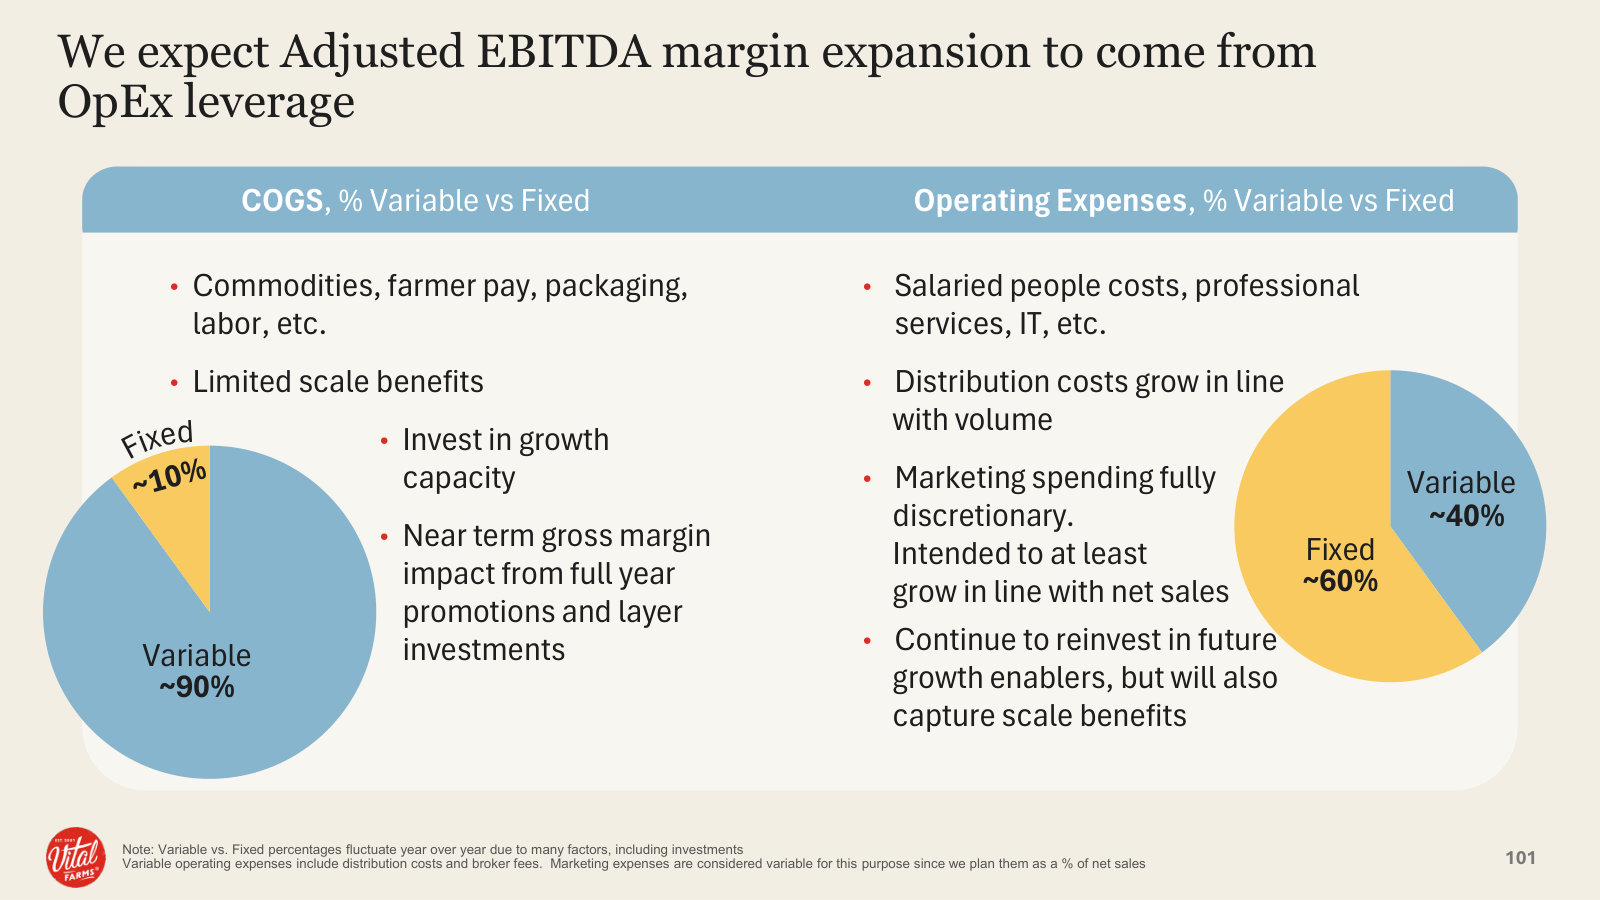
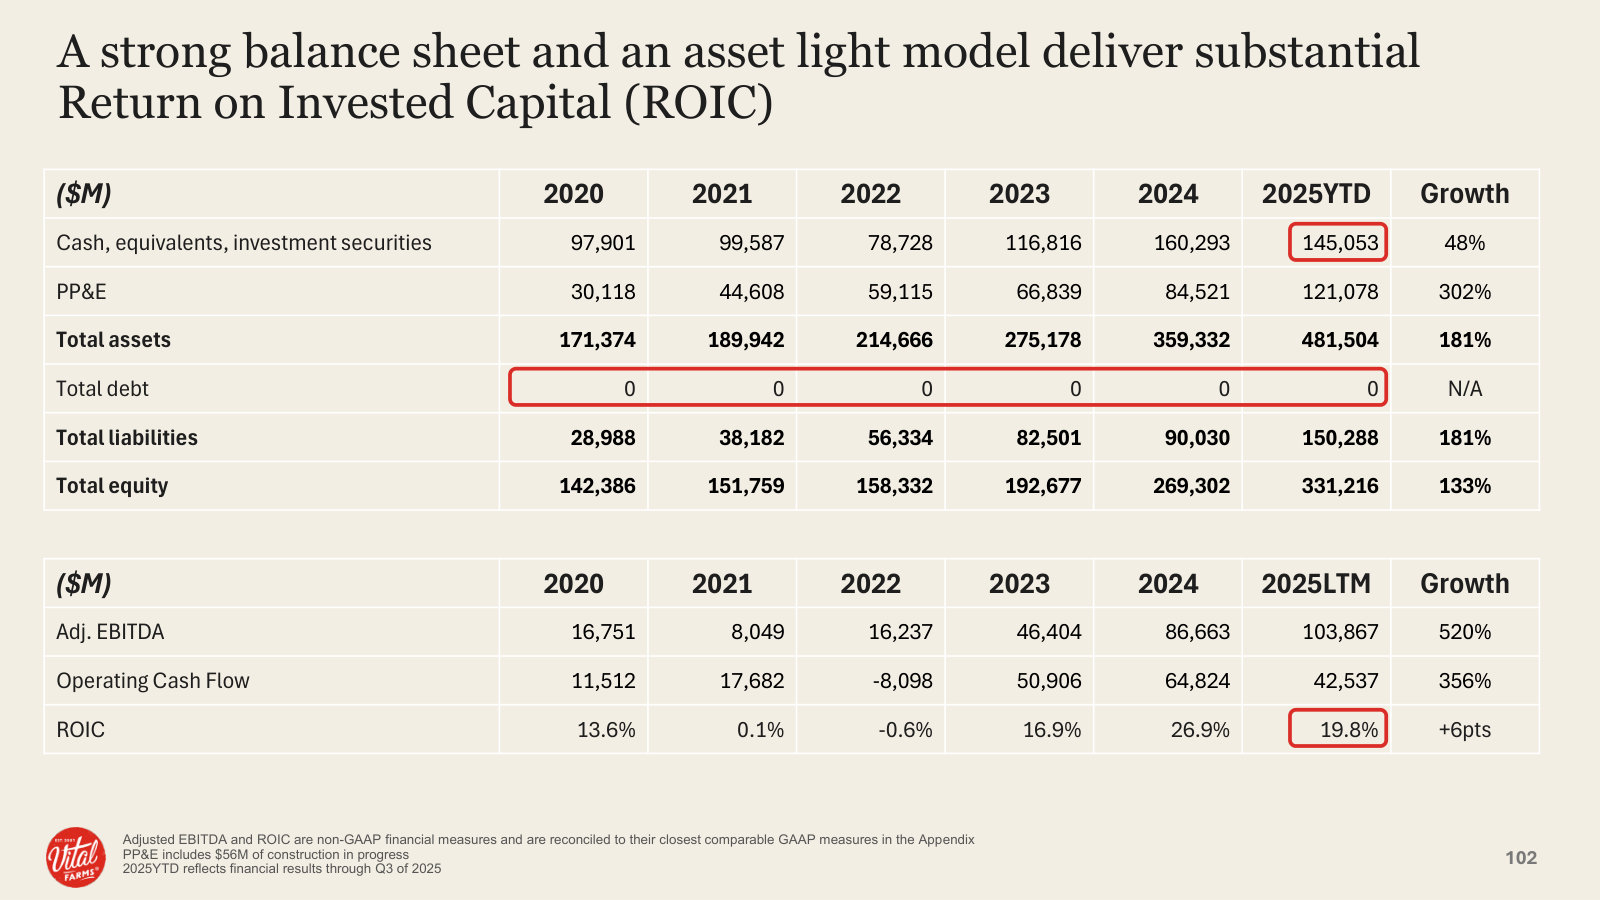
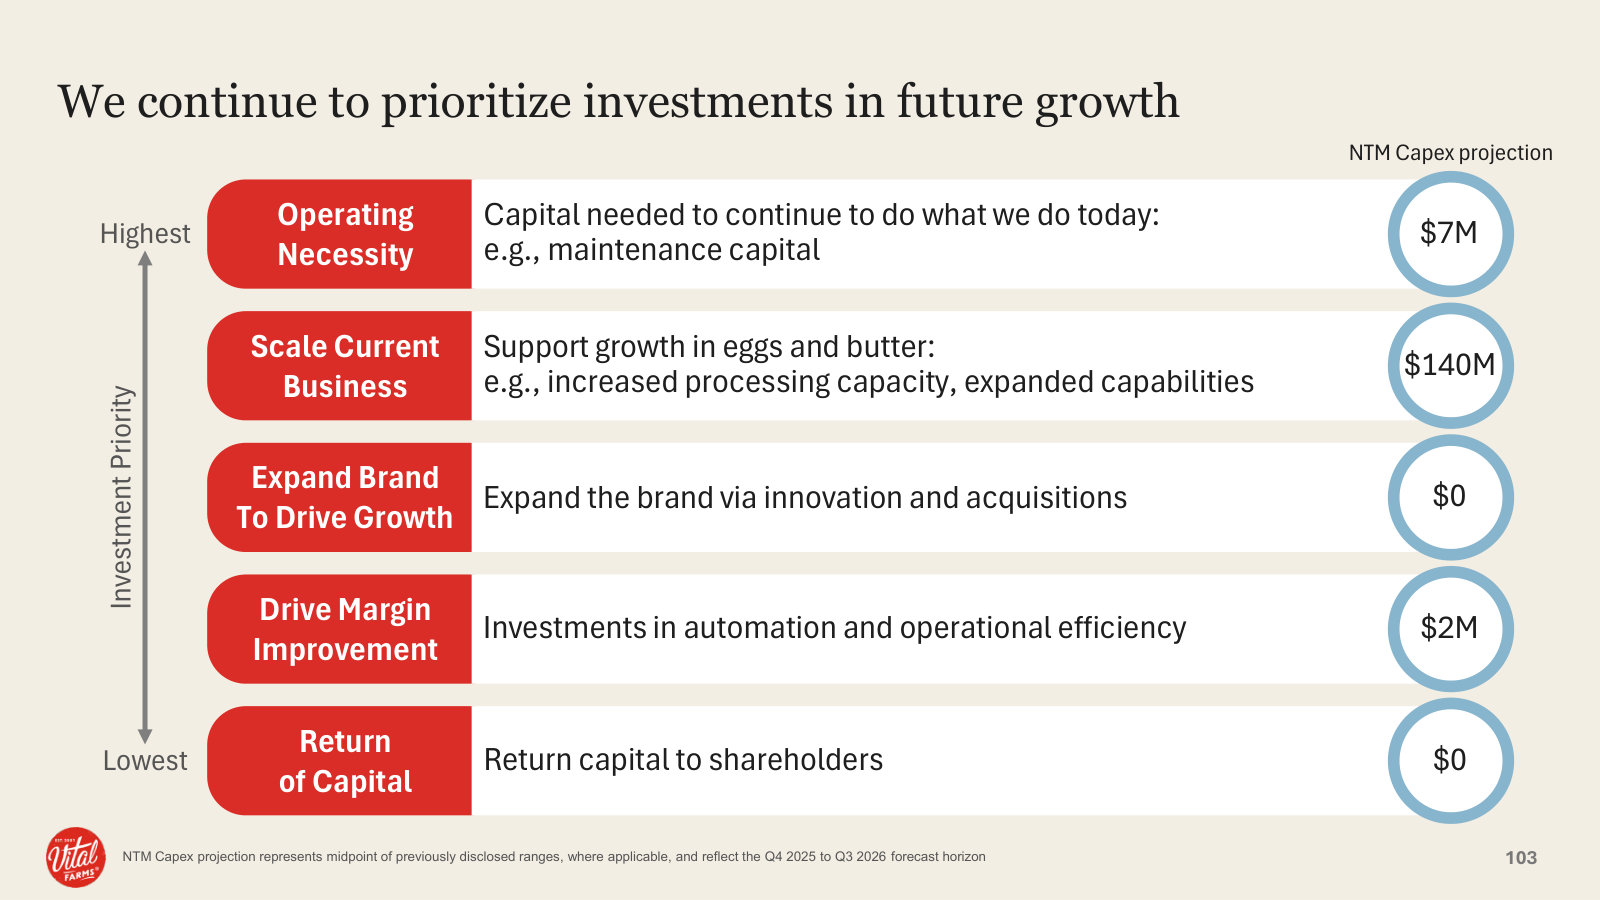
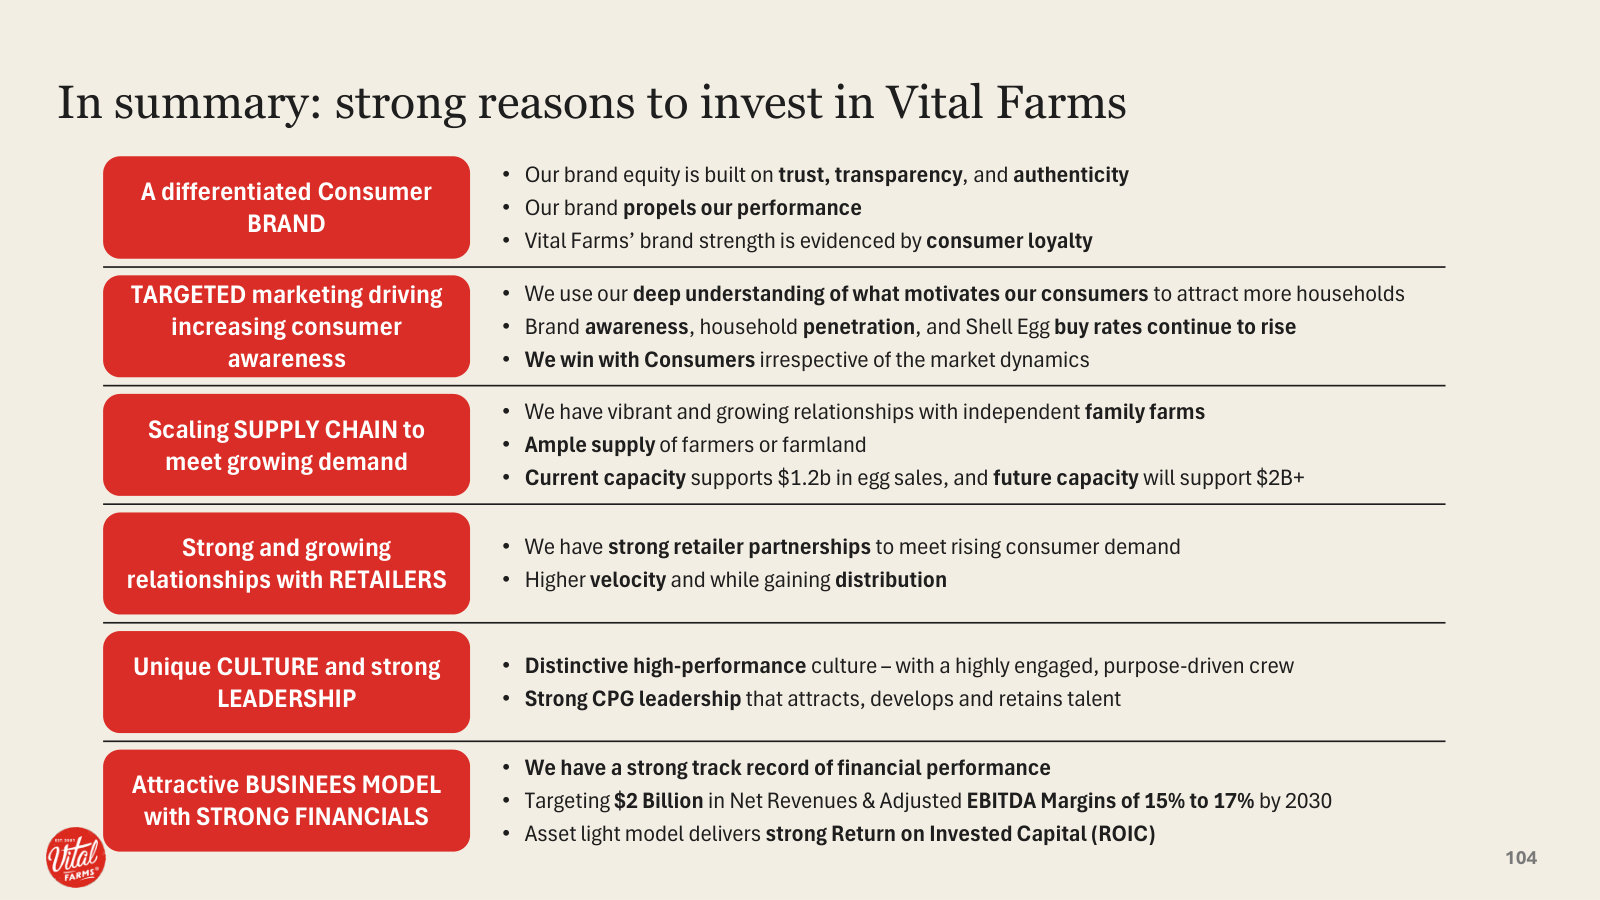
p. 7 — The six-part framework the whole day is built on — brand, farmers, capacity, retailers, culture, financials. · Open the full presentation →p. 8 — The business in five numbers: 15.7M households, ~23,500 retailers, 575 family farms, two processing plants. · Open the full presentation →p. 10 — Pasture-to-plate supply chain in one diagram — family farms through processing to 23,500 stores. · Open the full presentation →p. 11 — Why the mix matters: pasture-raised eggs (+27%) and grass-fed butter (+18%) are the fastest-growing segments. · Open the full presentation →p. 12 — Net sales have beaten both the IPO and 2023 analyst-day forecasts every year — a 29% CAGR since 2020. · Open the full presentation →p. 13 — The new 2030 targets management is now measured against: $2B revenue, 35%+ gross margin, 15-17% EBITDA. · Open the full presentation →p. 14 — The six operating levers management says get it to $2B in revenue by 2030. · Open the full presentation →p. 22 — How Vital Farms breaks CPG convention — 'the Rule' versus 'the Vital Farms Way' on advertising, scale, animals. · Open the full presentation →p. 24 — The awareness strategy at work: since 2022 Vital Farms pulled well ahead of competitors on aided awareness. · Open the full presentation →p. 25 — The flywheel: rising brand awareness pulls total households up alongside it, 2020 to Q3 2025. · Open the full presentation →p. 26 — New buyers more than double their purchase frequency by year two — the loyalty case in one chart. · Open the full presentation →p. 29 — The target consumer 'Bridget & Ben' — who they are, what they spend, and how many households remain. · Open the full presentation →p. 34 — The tangible proof points behind the brand — 52 quality factors, the Vital Times insert, See-a-Farm. · Open the full presentation →p. 43 — The category it competes in: shell eggs are a ~$16B, growing, high-traffic category for retailers. · Open the full presentation →p. 45 — The structural tailwind: outdoor-access eggs have more than doubled to 13% of shell-egg volume since 2020. · Open the full presentation →p. 48 — The farm network mapped — nearly doubled to 575 farms and 10M birds in two years across the Pasture Belt. · Open the full presentation →p. 51 — The farmer relationship in numbers: 95% annual retention, and half of 2025's new farmers came by referral. · Open the full presentation →p. 53 — Why supply isn't the ceiling — Vital Farms occupies under 0.02% of Pasture Belt farmland today. · Open the full presentation →p. 54 — Two new supply programs — company-owned Accelerator Farms and contracted pullet farms. · Open the full presentation →p. 58 — The two processing plants: Egg Central Station in Missouri, and Vital Crossroads in Indiana (2027). · Open the full presentation →p. 60 — How capacity is built ahead of demand — facility revenue capacity tracking the path toward $2B. · Open the full presentation →p. 61 — Inside the plant: automation — case packers and robotic palletizers adding capacity and easing labor. · Open the full presentation →p. 65 — Vital Crossroads, the second plant and the key capacity unlock, on track to open in 2027. · Open the full presentation →p. 71 — How Vital Farms grows inside a retailer — the four-stage path from first distribution to more shelf space. · Open the full presentation →p. 72 — The retail footprint: the #1 or #2 branded shell egg by dollar share at 9 of its top 10 retailers. · Open the full presentation →p. 74 — The first-mover case: Vital Farms kept growing volume while competitive pasture-raised entries barely moved. · Open the full presentation →p. 75 — Head-to-head at Kroger since 2015 — Vital Farms compounded ~30% while 'Brand B' was pulled from shelves. · Open the full presentation →p. 79 — Pricing power: Vital Farms grew category share even as its price premium widened to $3.43 a dozen. · Open the full presentation →p. 88 — The stakeholder model management says guides its decisions — the eight groups it weighs, and why. · Open the full presentation →p. 94 — The 2025 guidance set at the investor day: $755-765M revenue, at least $115M adjusted EBITDA. · Open the full presentation →p. 98 — What actually drove five years of retail growth — velocity (40%) and distribution (33%), not price or promo. · Open the full presentation →p. 100 — The P&L track record: gross profit (+31% CAGR), adjusted EBITDA (+47%), and operating cash flow since 2020. · Open the full presentation →p. 101 — Where future margin comes from — COGS is ~90% variable, so leverage has to come from operating expenses. · Open the full presentation →p. 102 — The balance-sheet case: zero debt, growing cash, and ~20% ROIC from an asset-light model. · Open the full presentation →p. 103 — How management ranks its capital-allocation priorities — and the next-twelve-months capex behind each. · Open the full presentation →p. 104 — The full investment case on one page — the six reasons management says to own Vital Farms. · Open the full presentation →
The current snapshot — how the 2026 egg-price reset hit margins, plus the latest operating metrics and cut full-year guidance. · Open the full document →
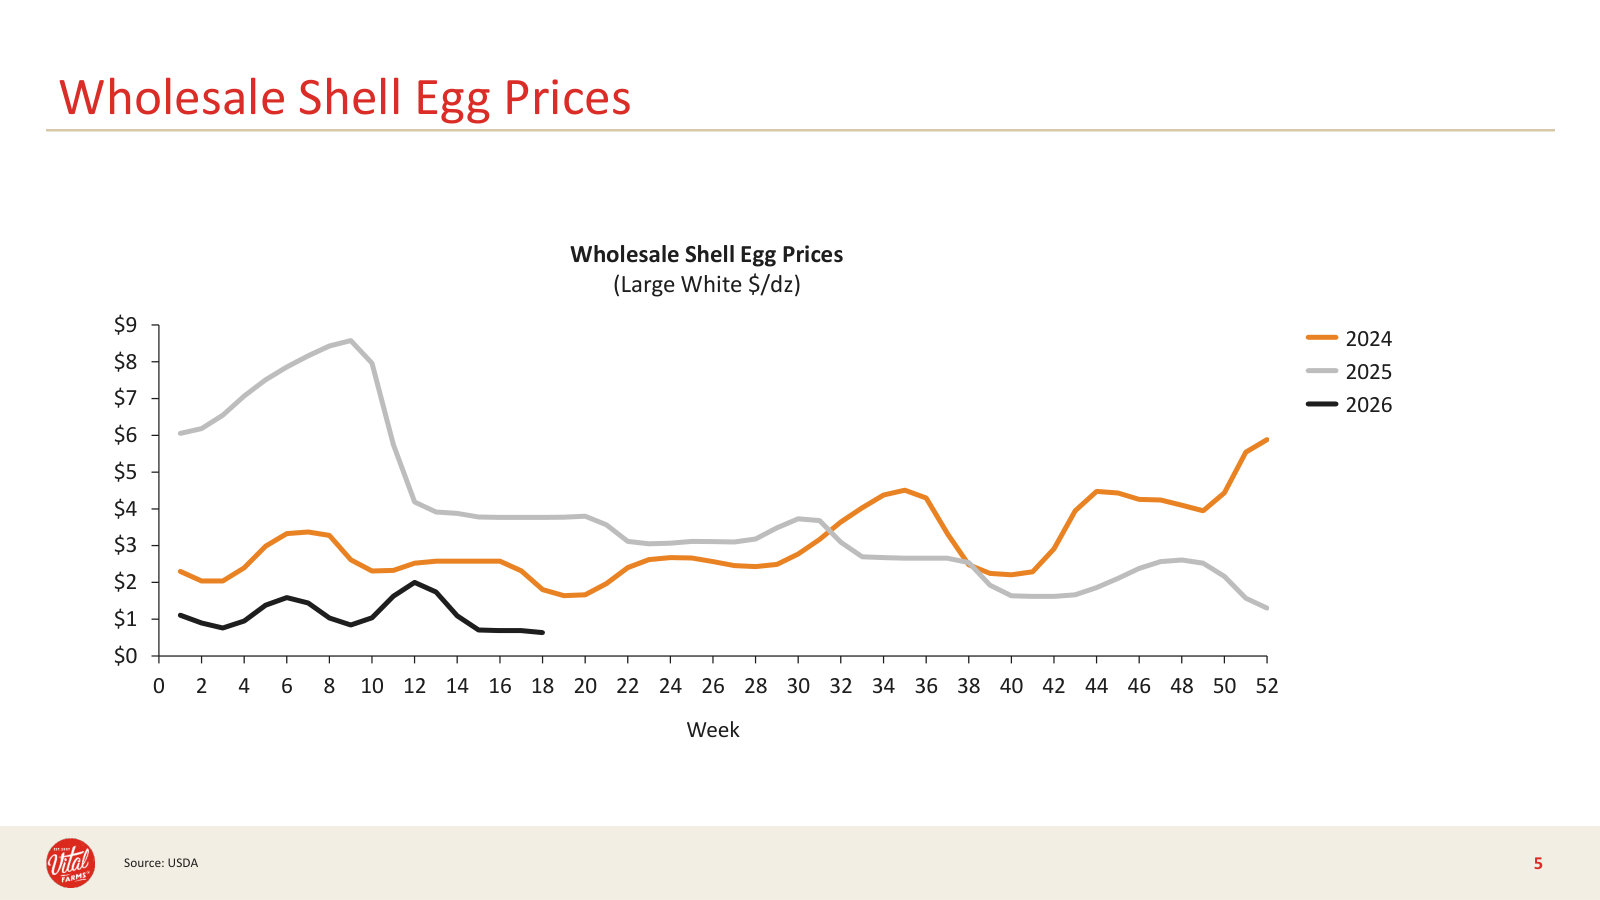
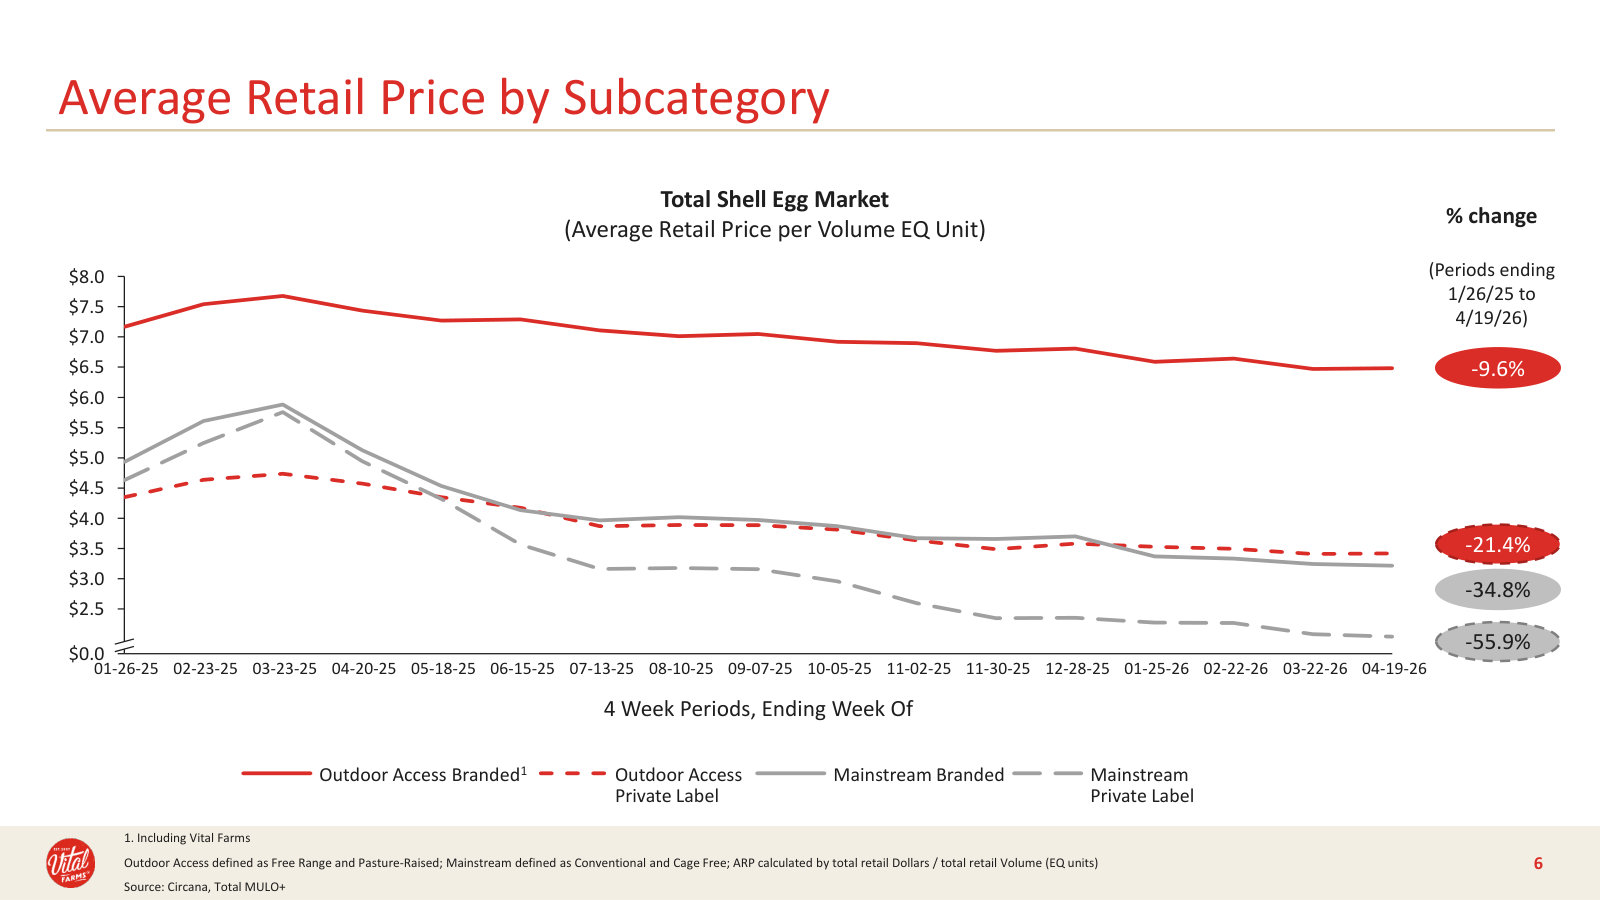
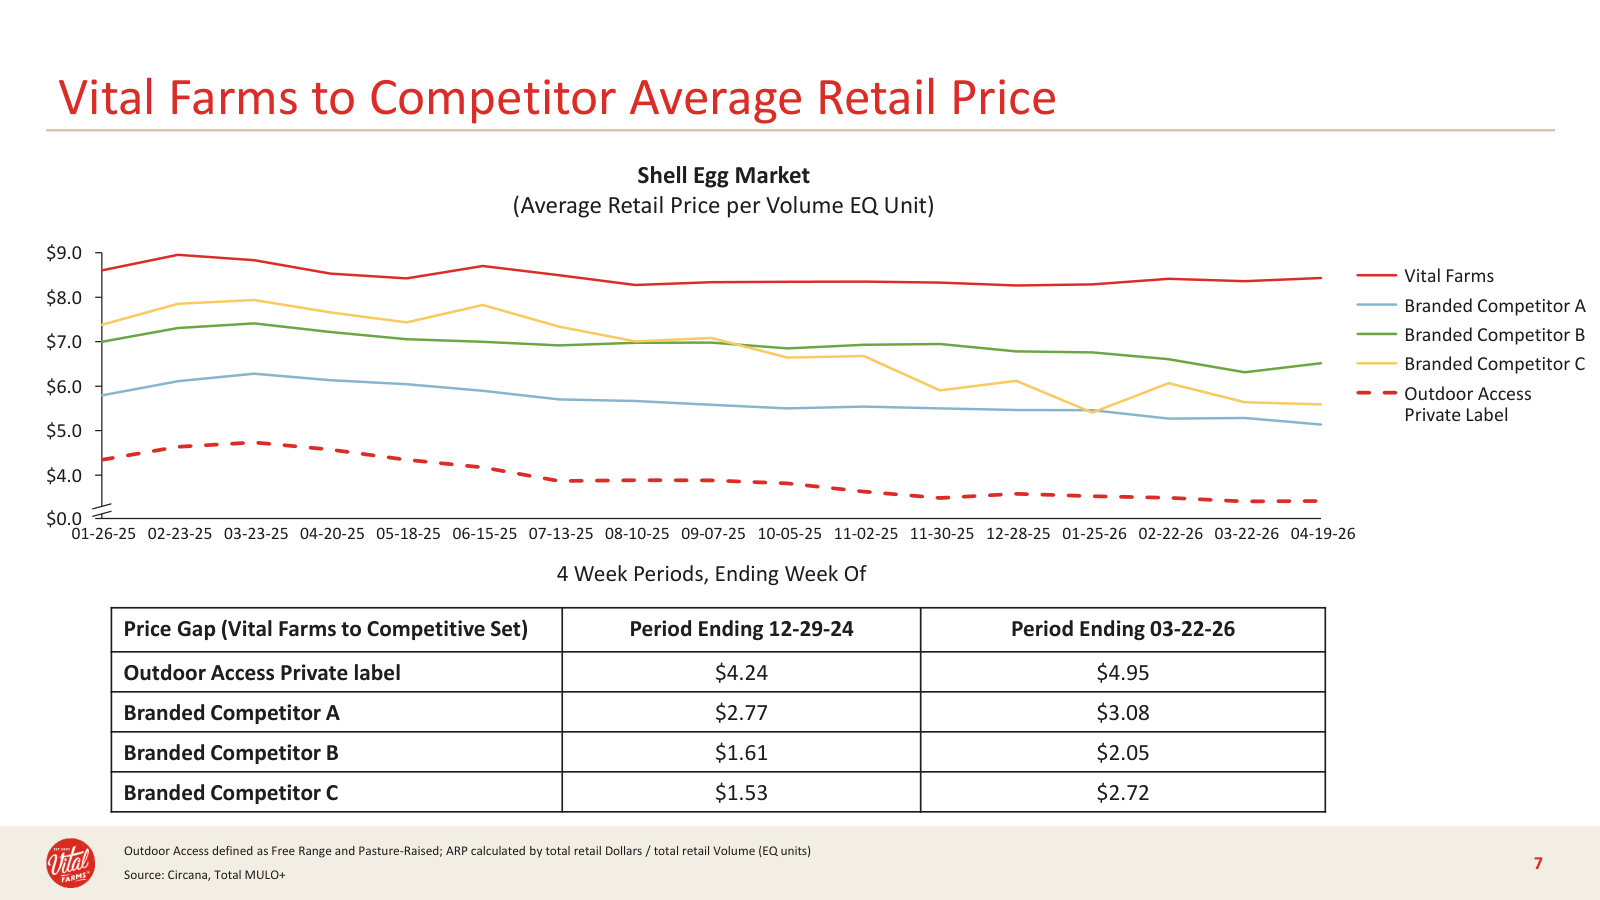
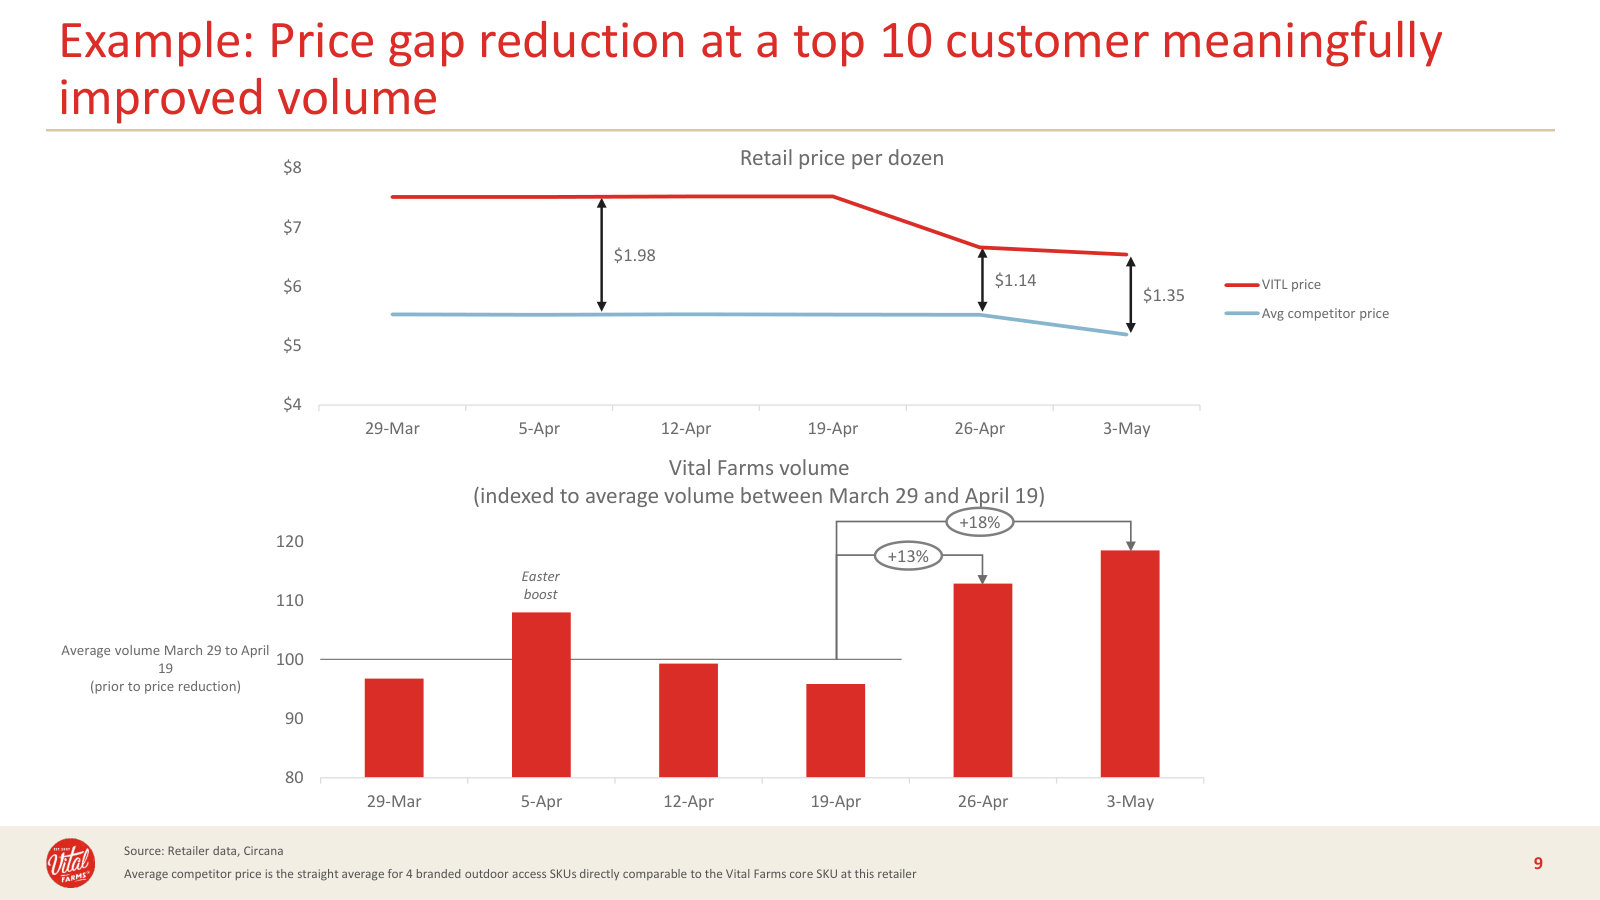
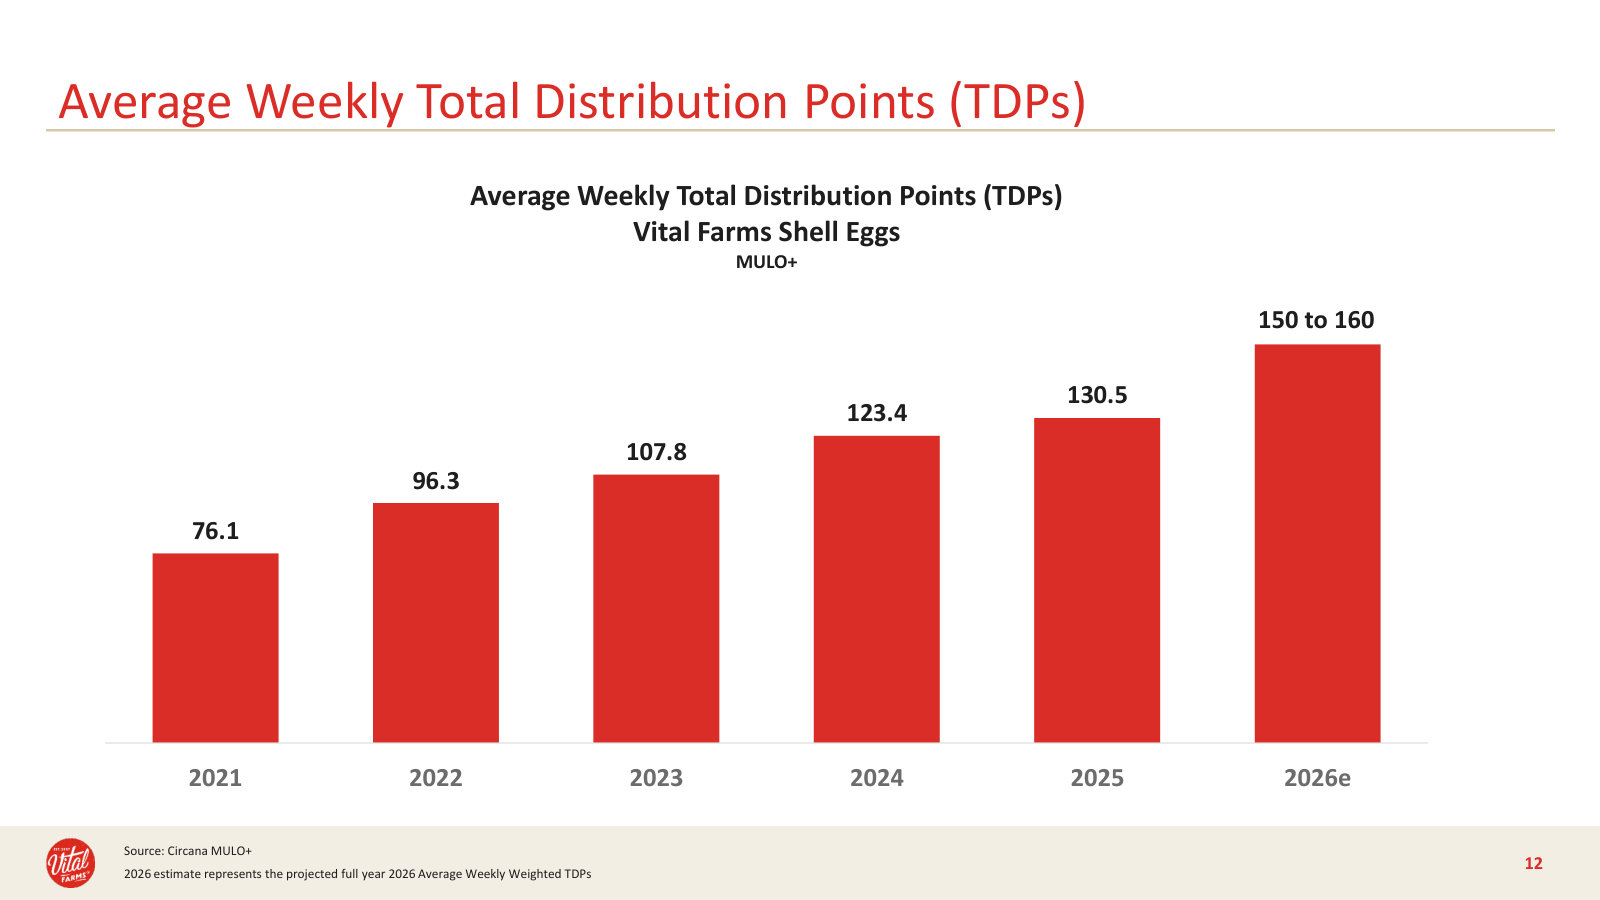
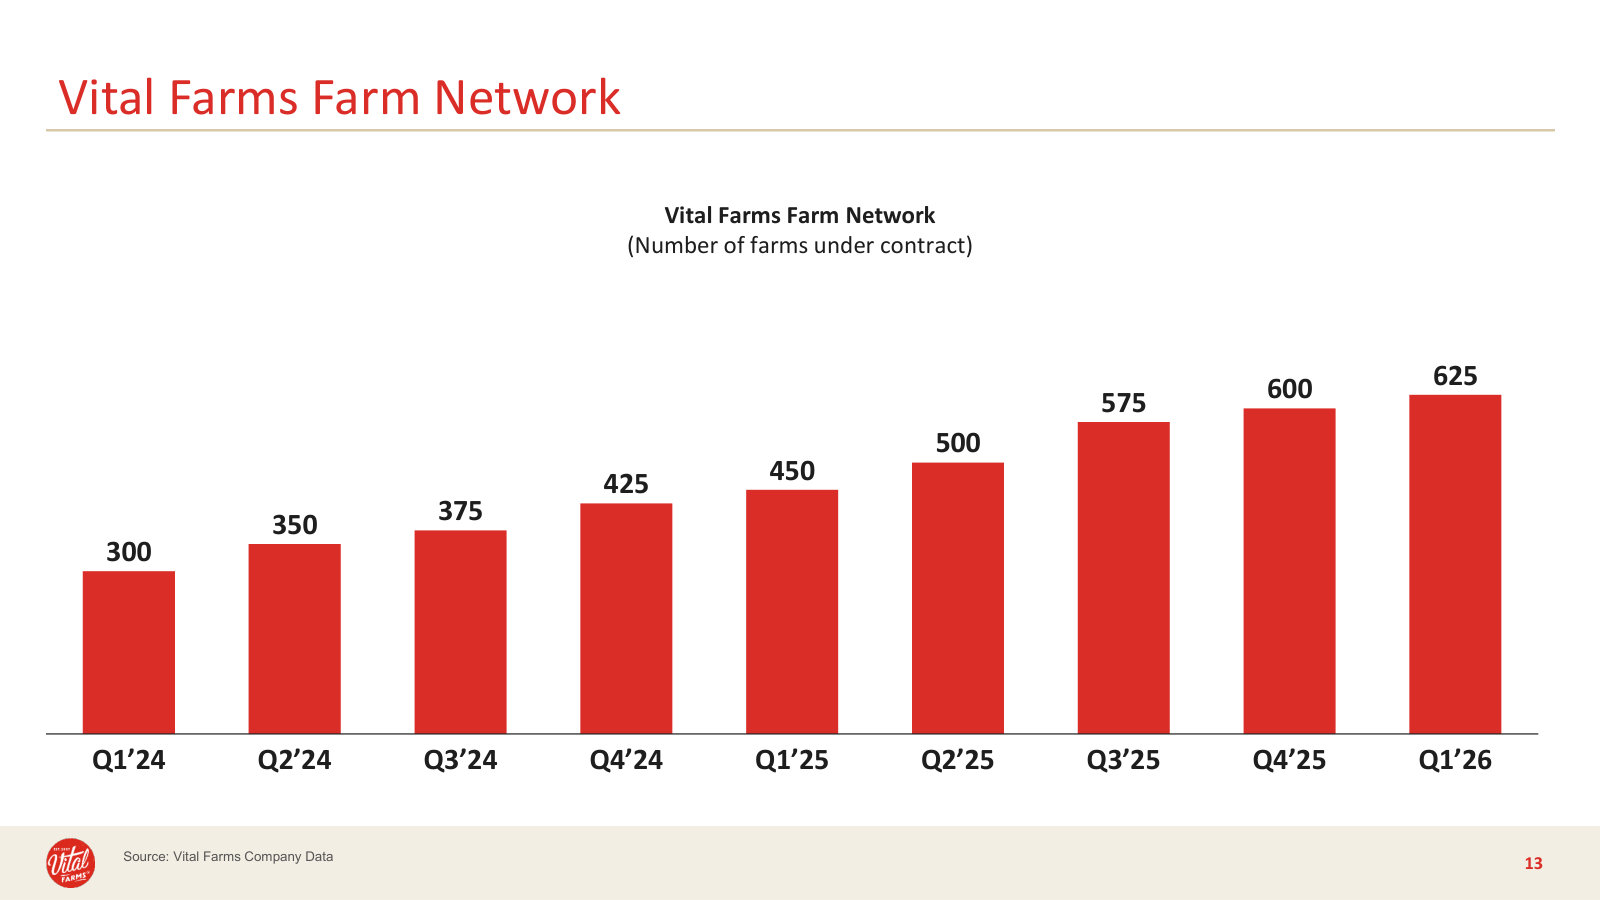
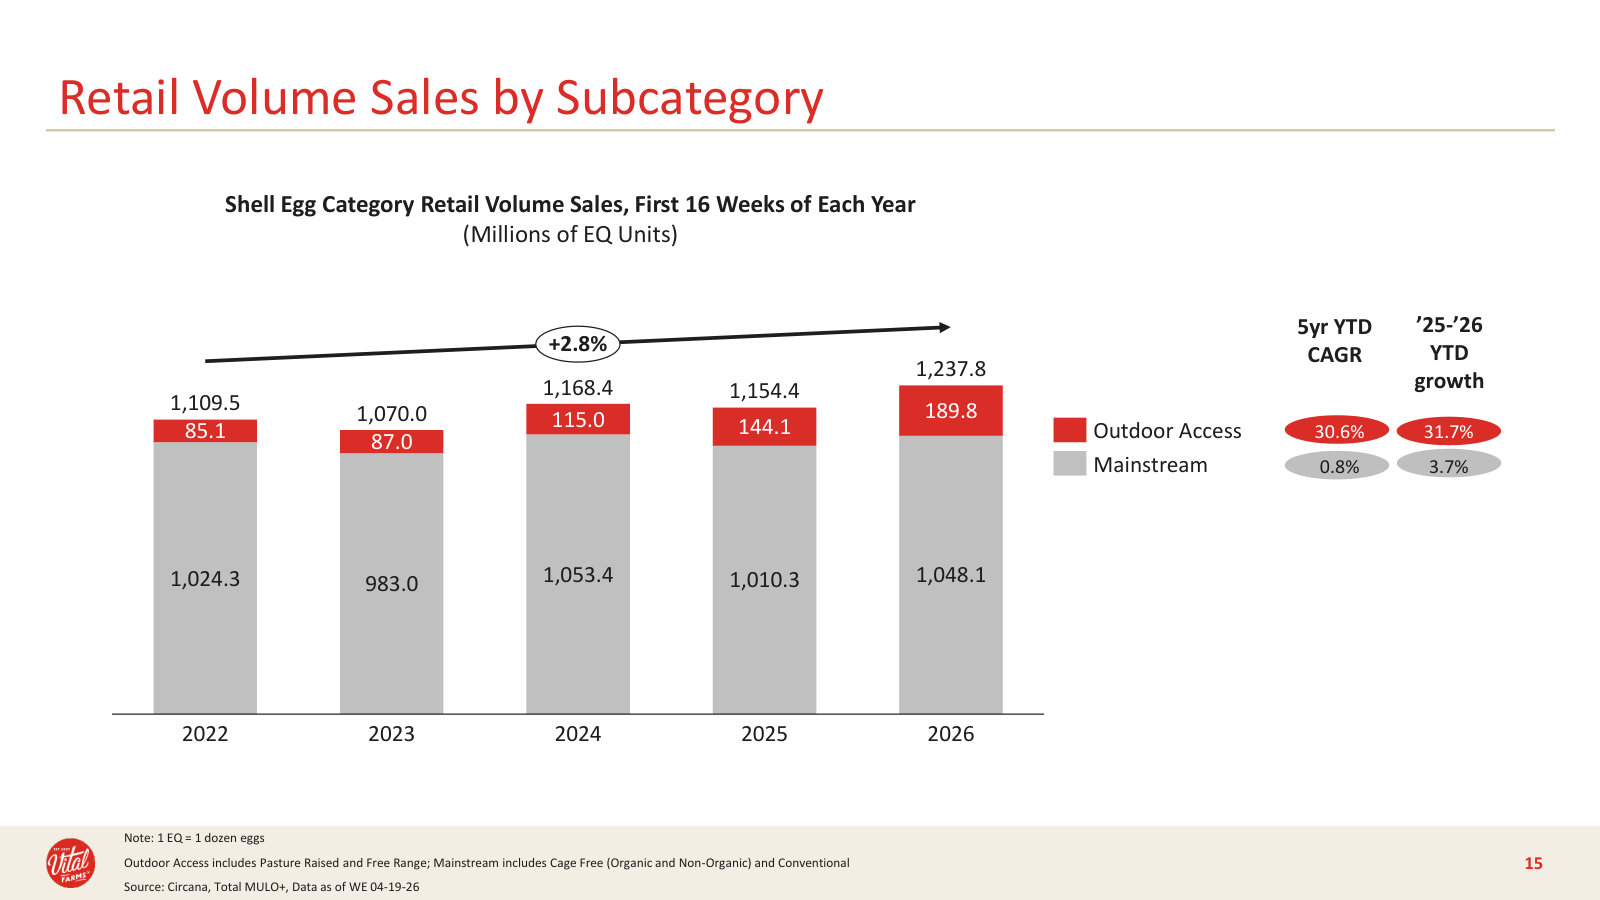
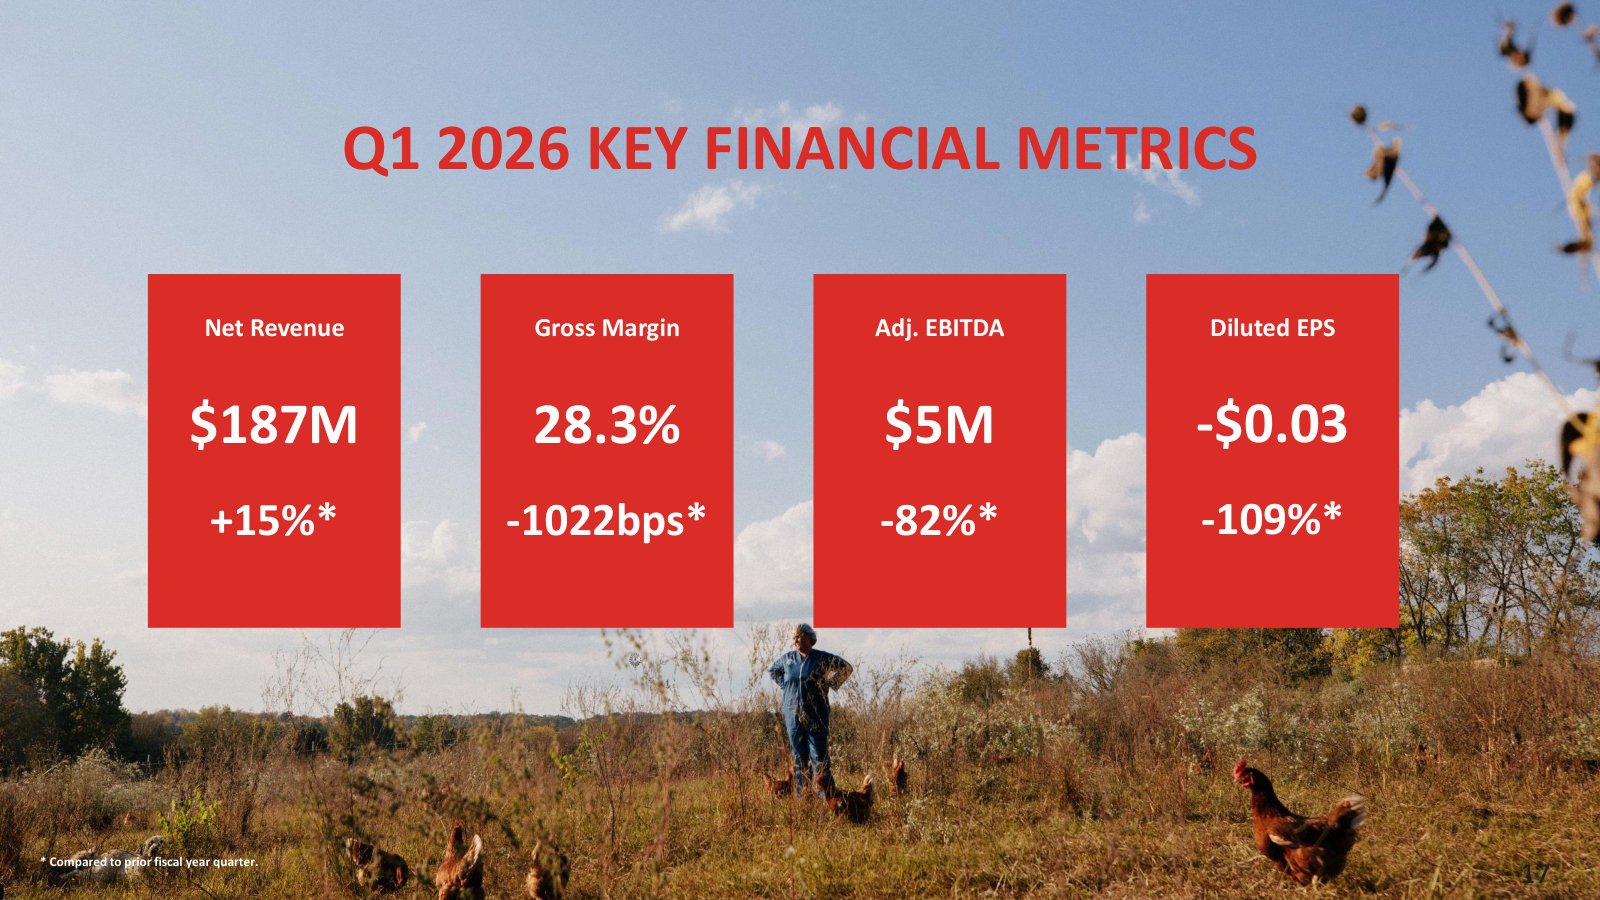
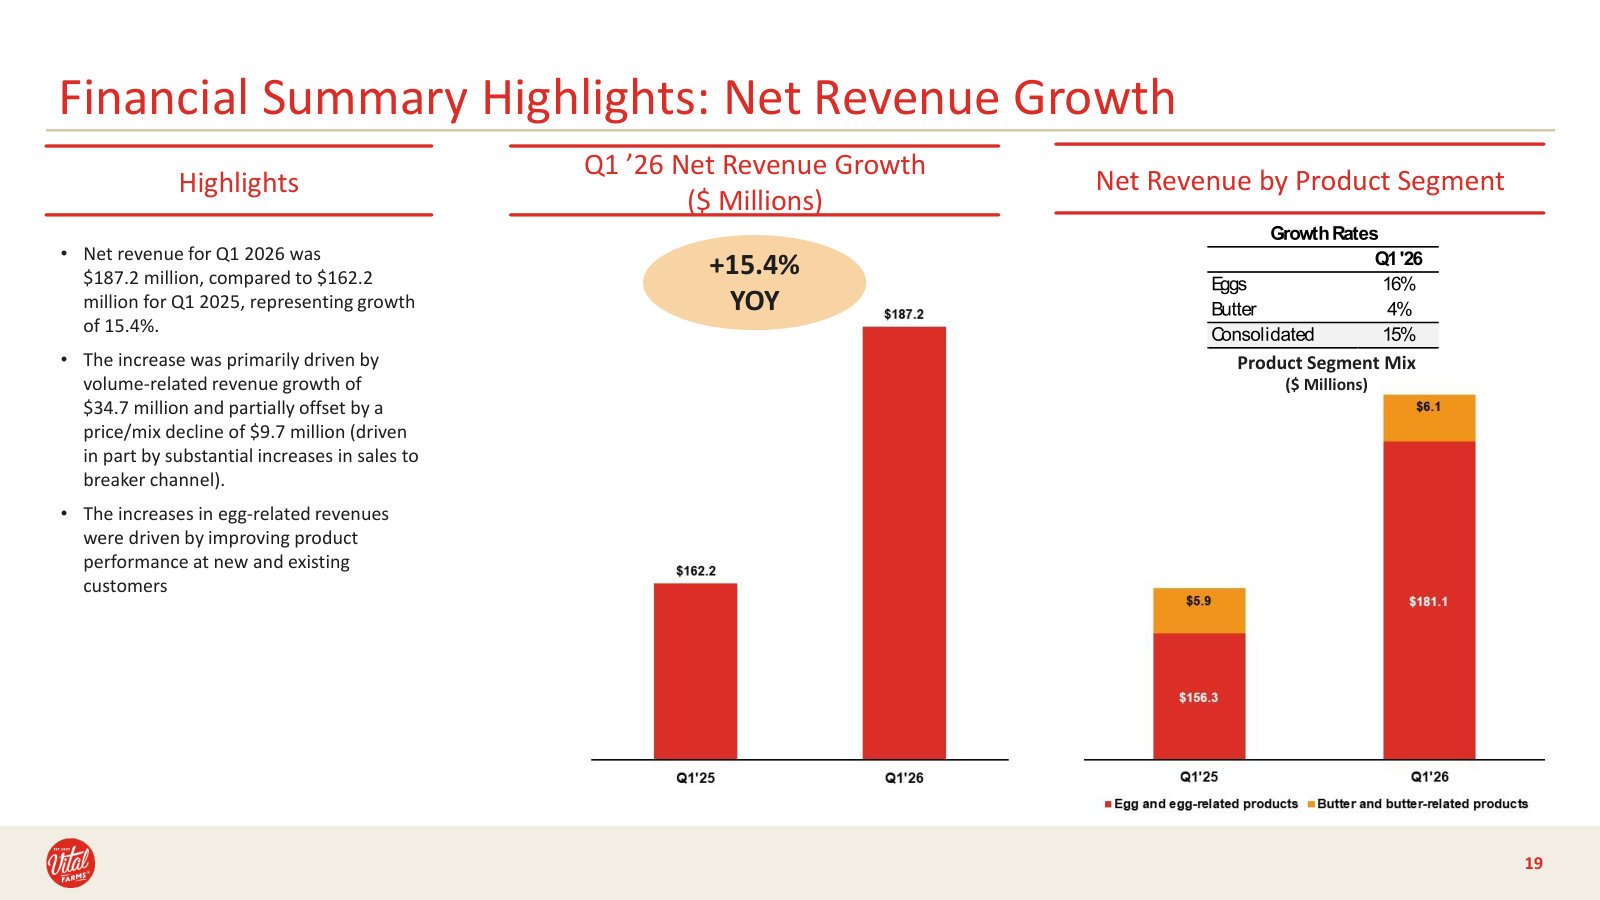
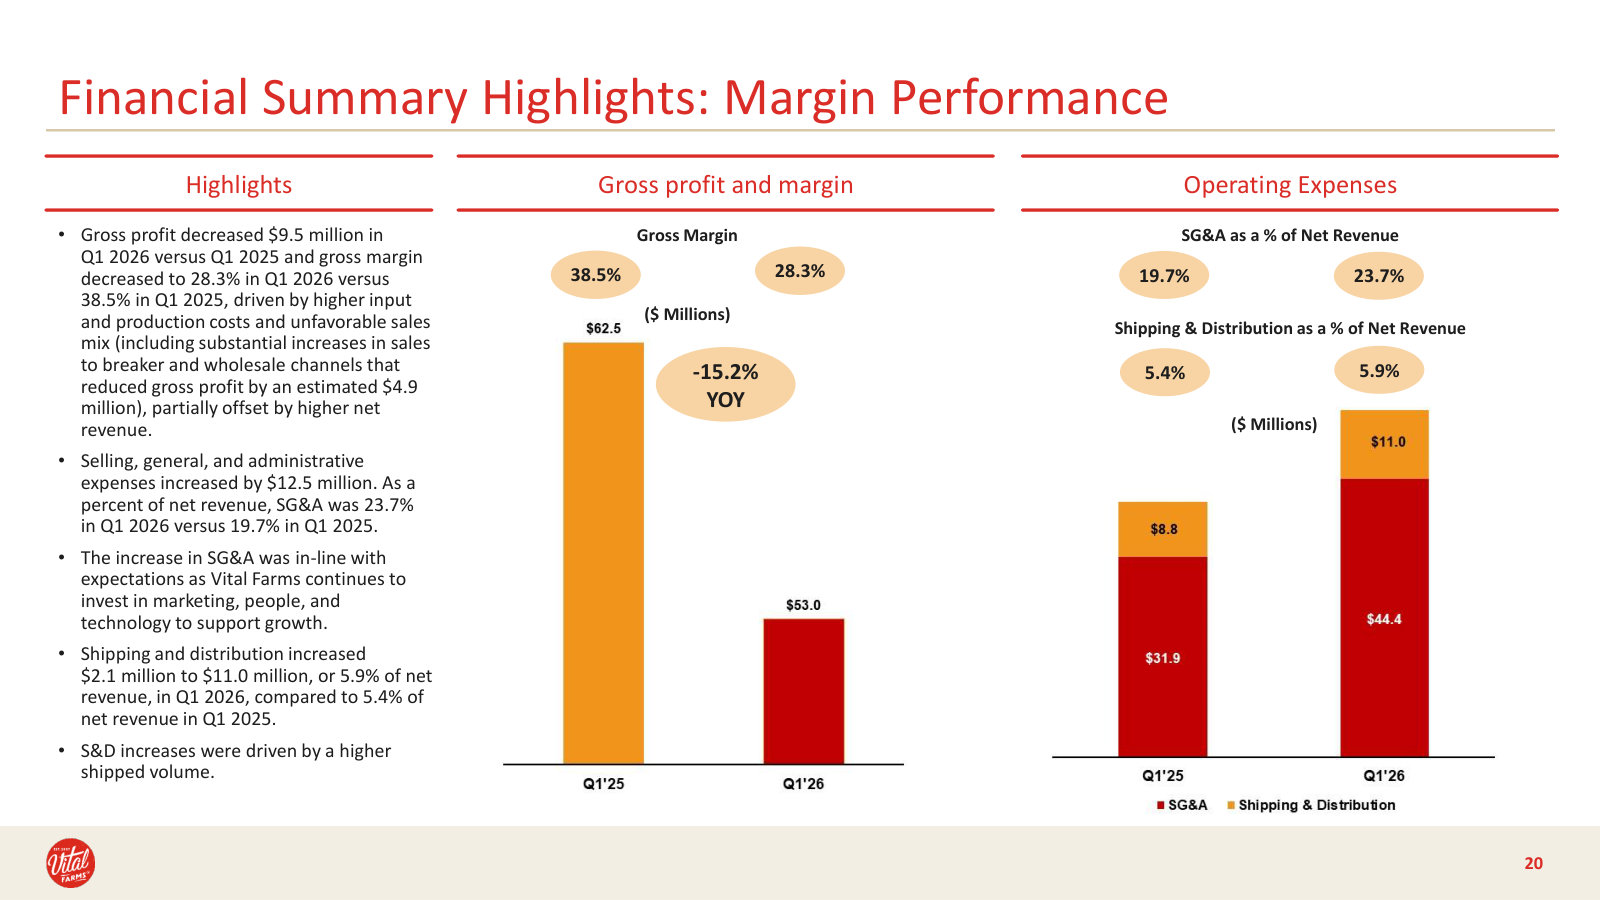
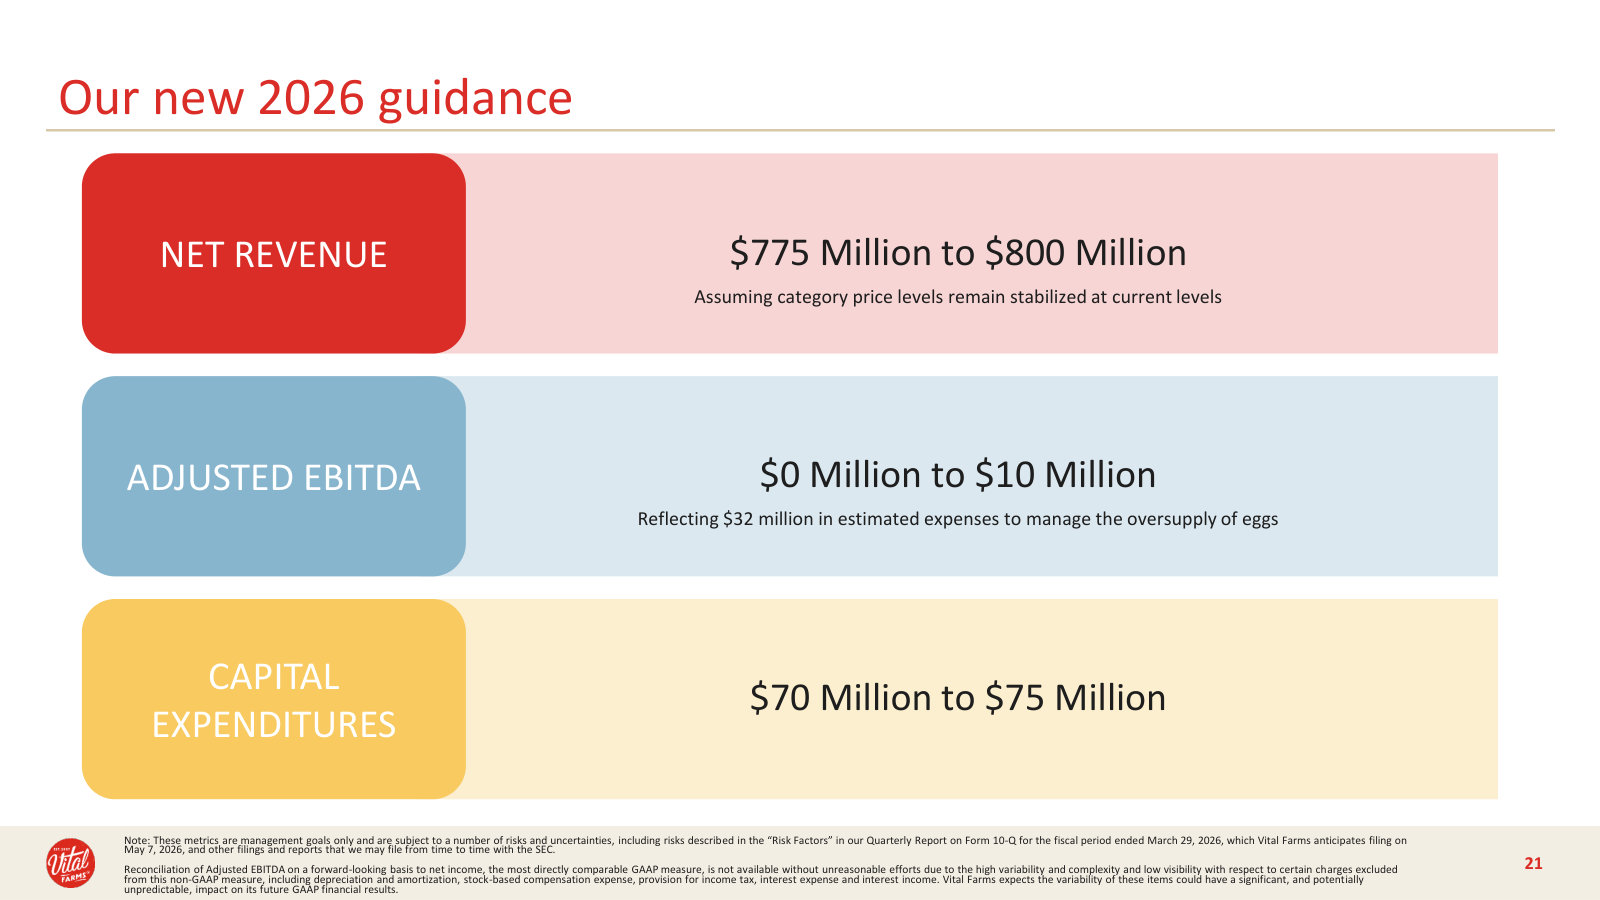
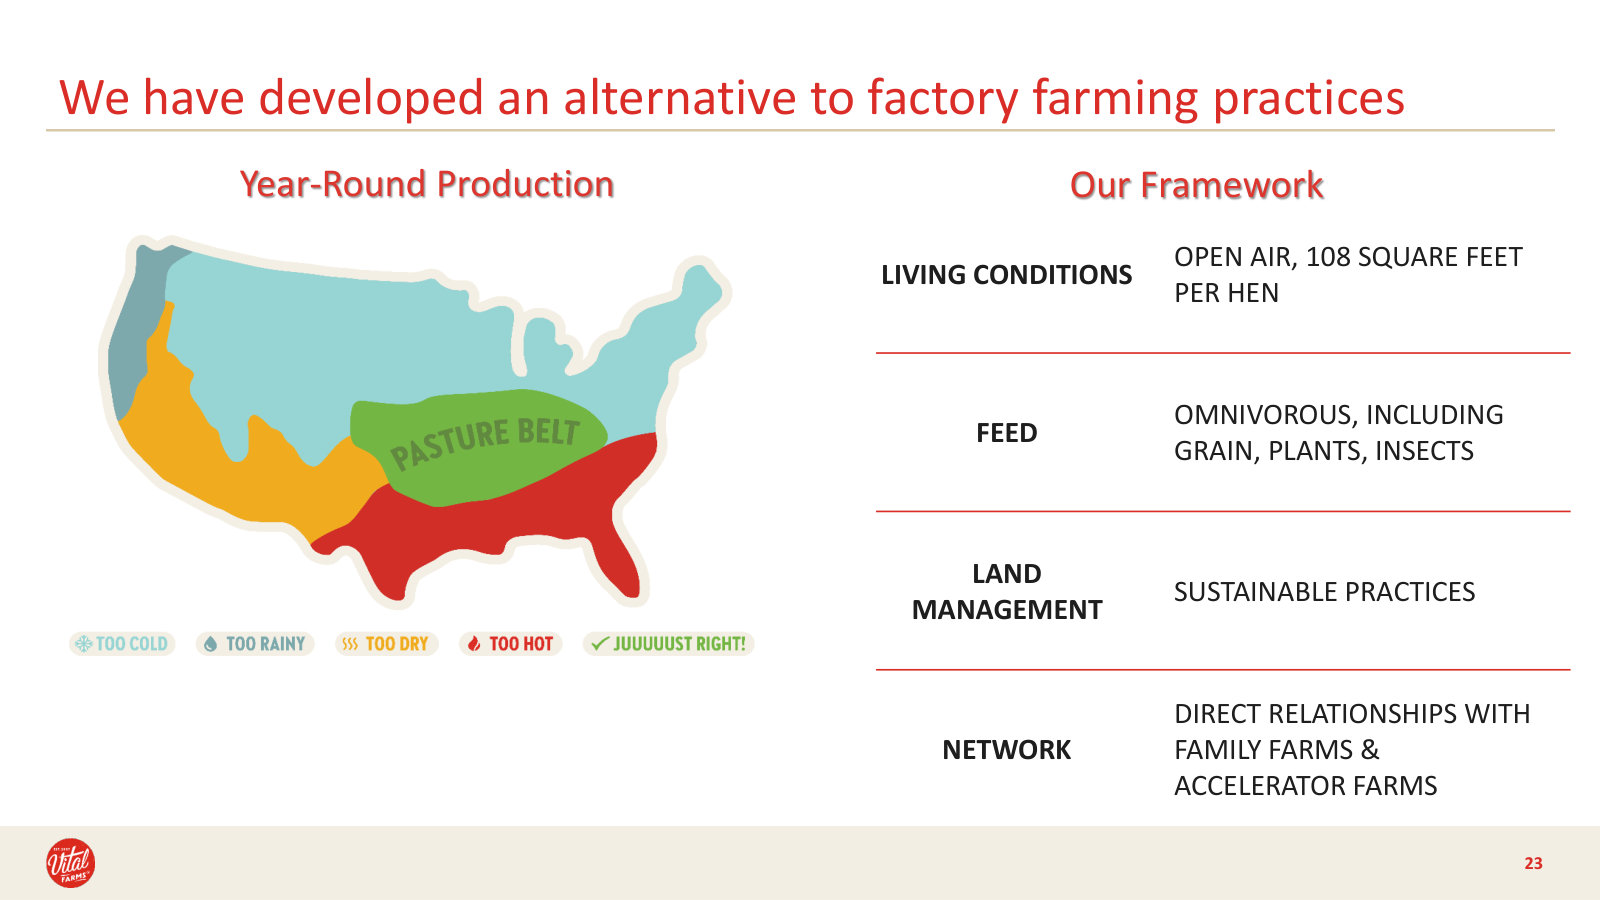
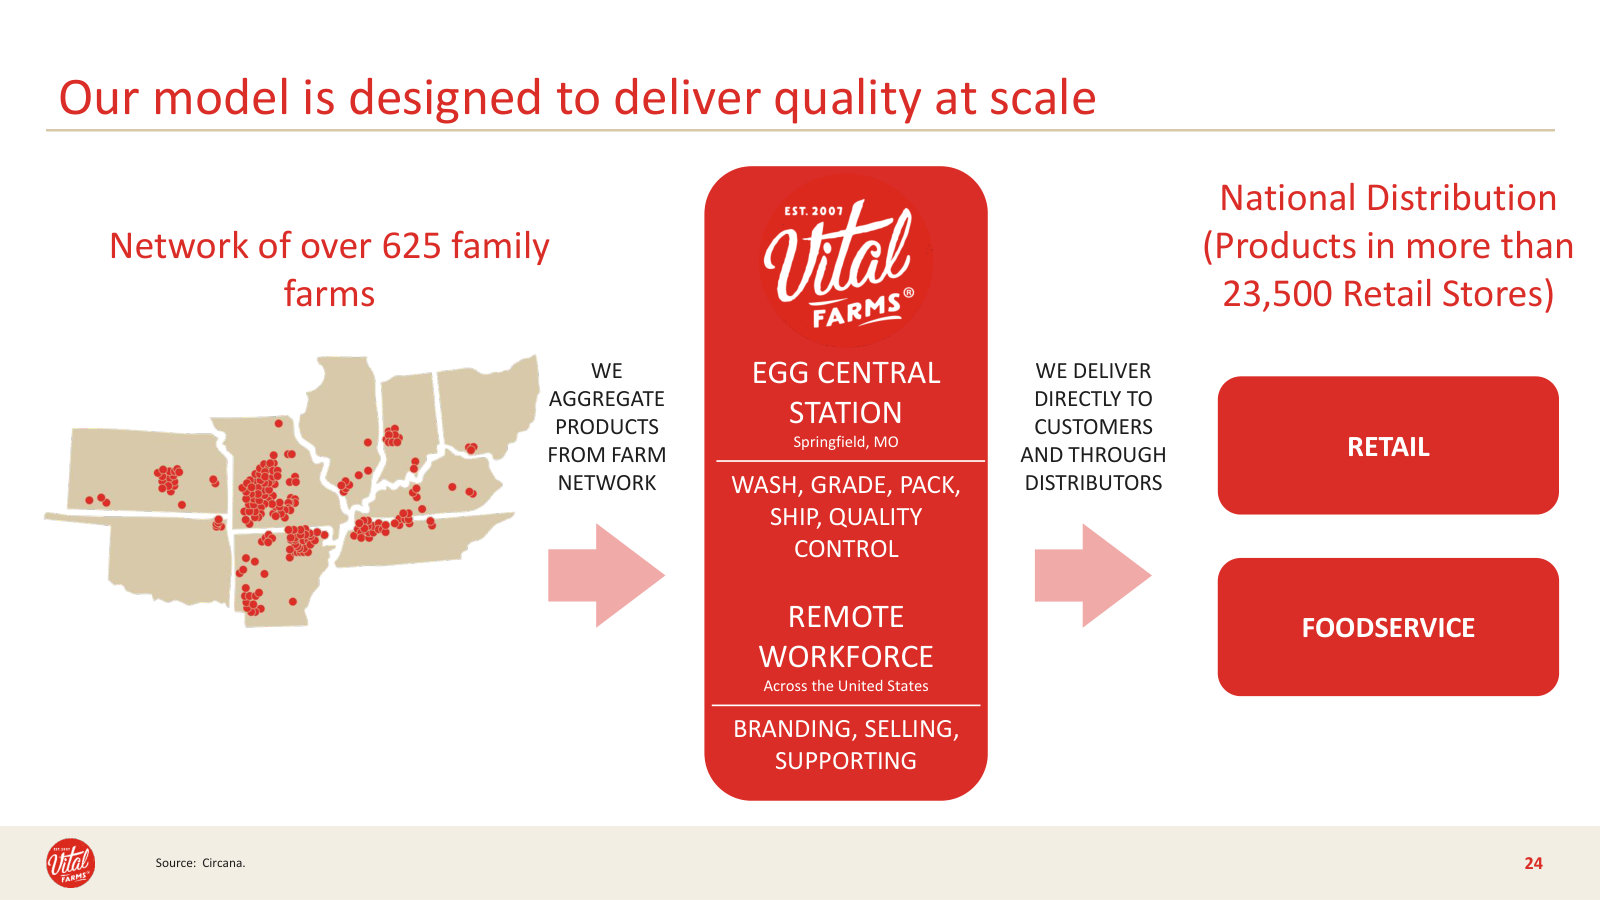
p. 5 — The 2026 backdrop: wholesale shell-egg prices have fallen sharply as avian-flu supply recovered. · Open the full presentation →p. 6 — How the price drop split the category — branded outdoor-access held up while private label fell hardest. · Open the full presentation →p. 7 — Vital Farms' retail price versus branded rivals, and how the price gap has widened through early 2026. · Open the full presentation →p. 9 — The lever management is pulling — narrowing the price gap at a large customer lifted volume ~18%. · Open the full presentation →p. 12 — Distribution keeps expanding — weekly total distribution points, guided to 150-160 in 2026. · Open the full presentation →p. 13 — The farm network as of Q1 2026 — up to 625 contracted farms, still adding ~25 a quarter. · Open the full presentation →p. 15 — The category shift, still running — outdoor-access egg volume up ~32% year-to-date versus a flat mainstream. · Open the full presentation →p. 17 — Q1 2026 at a glance: revenue +15% to $187M, but margins and EBITDA compressed on egg oversupply. · Open the full presentation →p. 19 — Where the growth came from — +15% revenue, volume-led, split across the egg and butter segments. · Open the full presentation →p. 20 — The margin squeeze in detail — gross margin fell to 28.3% on higher costs and unfavorable mix. · Open the full presentation →p. 21 — The reset 2026 guidance — $775-800M revenue but just $0-10M EBITDA, absorbing ~$32M of oversupply cost. · Open the full presentation →p. 23 — The pasture-raised standard, and the 'Pasture Belt' geography that makes year-round production work. · Open the full presentation →p. 24 — The operating model on one slide — 625 farms feed Egg Central Station, then retail and foodservice. · Open the full presentation →
Q4 & Full-Year 2025 Results — Q4/FY 2025 · 22 pages · The full-year 2025 scorecard and the jumping-off point into 2026, two months before the egg-price reset showed up. · Open →
Q1 2025 Investor Presentation — Q1 2025 · 18 pages · Where the earlier 2027 targets were laid out — the plan the 2025 investor day later replaced with 2030 goals. · Open →
Q4 & Full-Year 2024 Results — Q4/FY 2024 · 23 pages · The full-year 2024 results deck — the prior annual baseline before the investor-day reset. · Open →